Fig. 13
Download original image
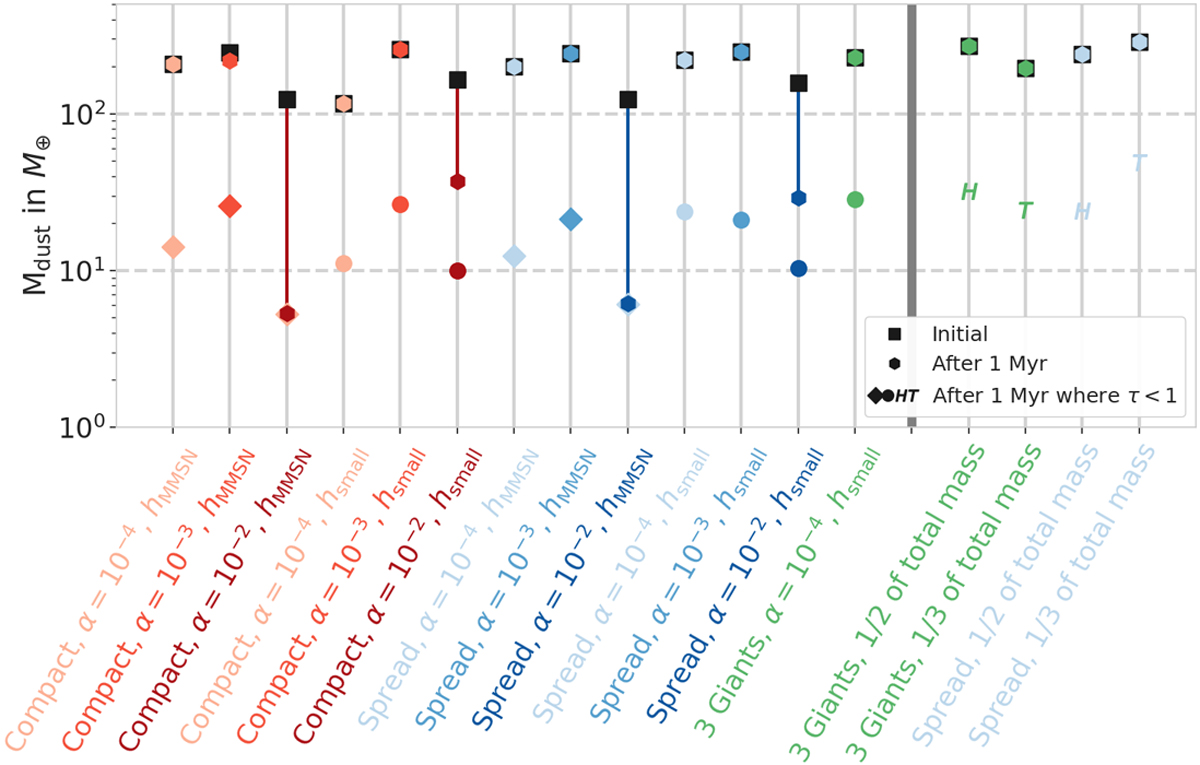
Masses of the dust disks for each configuration and each disk parameter derived from the dust evolution model. The squares correspond to the initial amount of dust mass, and the circles show how much of this mass is left after 1 Myr of dust evolution. The differences in initial dust masses for all disks originate from the assumption that the dust-to-gas ratio is initially 0.01 and the inner disk is depleted in dust by the giant planets (see Sect. 3.1). In most cases, all the dust is trapped in the disks, except at high viscosity because the planet gaps are not strong enough to prevent the dust from flowing toward the star. To compare to observed dust masses as in Fig. 14, we also derive the dust contained in the optically thin regions (represented by the markers corresponding to Fig. 14). We seehere that the majority of the mass is hidden in the optically thick regions.
Current usage metrics show cumulative count of Article Views (full-text article views including HTML views, PDF and ePub downloads, according to the available data) and Abstracts Views on Vision4Press platform.
Data correspond to usage on the plateform after 2015. The current usage metrics is available 48-96 hours after online publication and is updated daily on week days.
Initial download of the metrics may take a while.