Fig. 11
Download original image
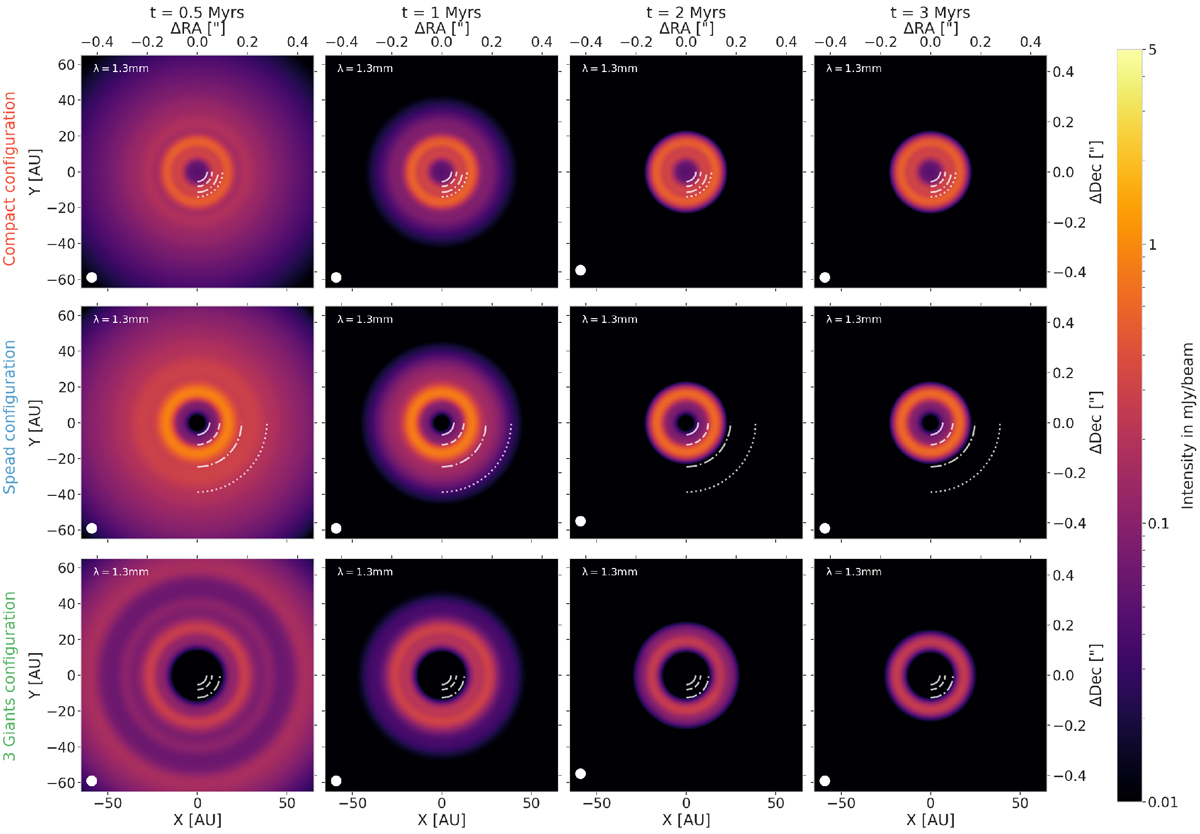
Images at λ = 1.3 mm of the different configurations, at low viscosity and low aspect ratio, at different times: 0.5 Myr, 1 Myr, 2 Myr, and 3 Myr, from left to right. The white lines represent the positions of the different planets in each configuration. We assume that the sensitivity of the instrument is limited to fluxes larger than 10 μJy beam−1. As time evolves, the sizes of the disks shrink due to inward drift, leaving stable rings in the inner disks after 1 Myr.
Current usage metrics show cumulative count of Article Views (full-text article views including HTML views, PDF and ePub downloads, according to the available data) and Abstracts Views on Vision4Press platform.
Data correspond to usage on the plateform after 2015. The current usage metrics is available 48-96 hours after online publication and is updated daily on week days.
Initial download of the metrics may take a while.