Fig. 10
Download original image
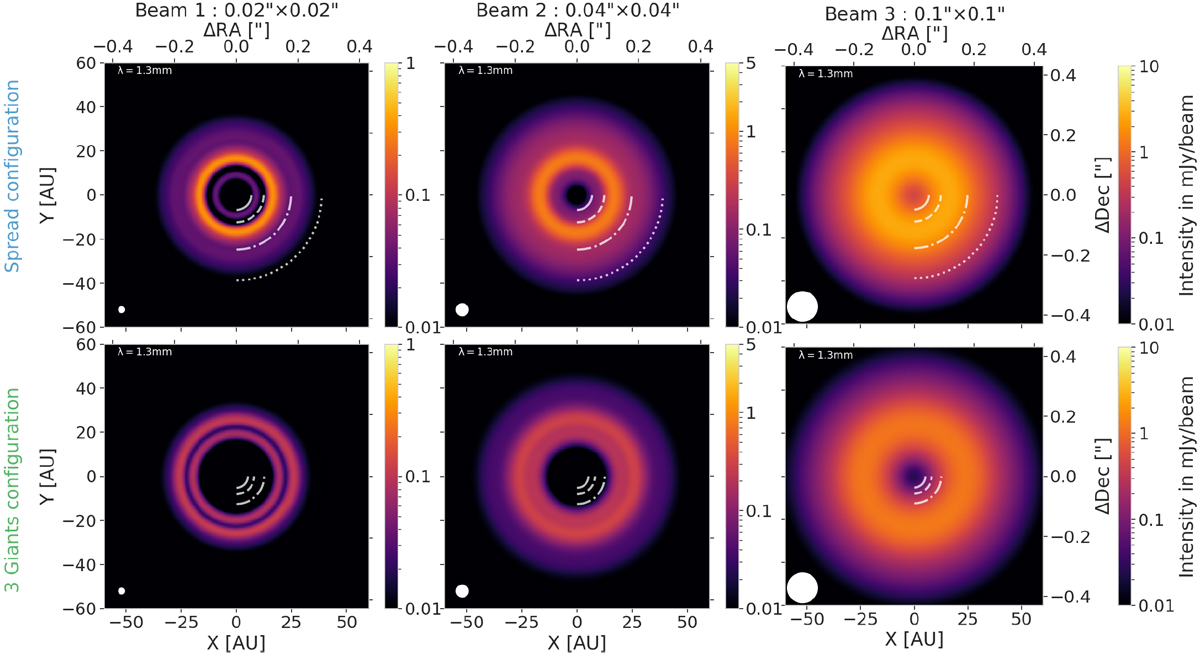
Images in total intensity at λ = 1.3 mm corresponding to the radial profiles presented in Fig. 6. The positions of the different planets are represented by the different white arcs. The different beams investigated range from 0.02′′ × 0.02′′ (left) to 0.1′′ × 0.1′′ (right) and are represented in the lower-left corner of each image by the white ellipses. We show the fiducial resolution (0.04′′ × 0.04′′) in the middle panel for comparison. The colorbars are adjusted for each resolution as they have different sensitivities. These images show the importance of resolution: the substructures start to be well represented at very high resolution.
Current usage metrics show cumulative count of Article Views (full-text article views including HTML views, PDF and ePub downloads, according to the available data) and Abstracts Views on Vision4Press platform.
Data correspond to usage on the plateform after 2015. The current usage metrics is available 48-96 hours after online publication and is updated daily on week days.
Initial download of the metrics may take a while.