Fig. 1
Download original image
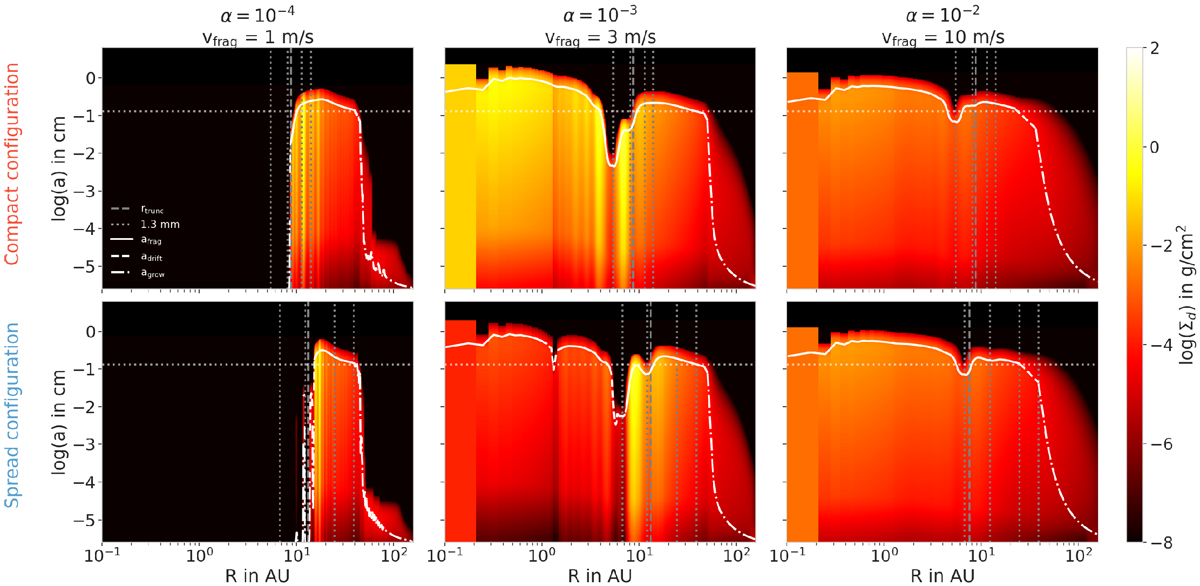
Dust densities distributions for the MMSN-like aspect ratio. Each line represents a Solar System configuration (Compact on the first row and Spread on the second row; cf. Table 1) and each column represents a set of α viscosity and fragmentation speed (increasing from left to right). The vertical dotted lines represent the positions of each planet.The vertical dashed line shows the truncation radius (Eq. (3)). The white lines represent the maximum size reached by the grains, and each line style represents a limiting mechanism: solid line for the fragmentation limit, dashed line for the drift limit, and dotted dashed line for the growth limit size. At high viscosities, dust from the outer regions flows through Jupiter and Saturn’s gap and replenishes the inner disk, which is not the case at low viscosity. At low viscosity, the perturbations induced by the planets in the gas velocity profiles produce dust over-densities (traffic jams), creating substructures not directly related to the positions of the planets.
Current usage metrics show cumulative count of Article Views (full-text article views including HTML views, PDF and ePub downloads, according to the available data) and Abstracts Views on Vision4Press platform.
Data correspond to usage on the plateform after 2015. The current usage metrics is available 48-96 hours after online publication and is updated daily on week days.
Initial download of the metrics may take a while.