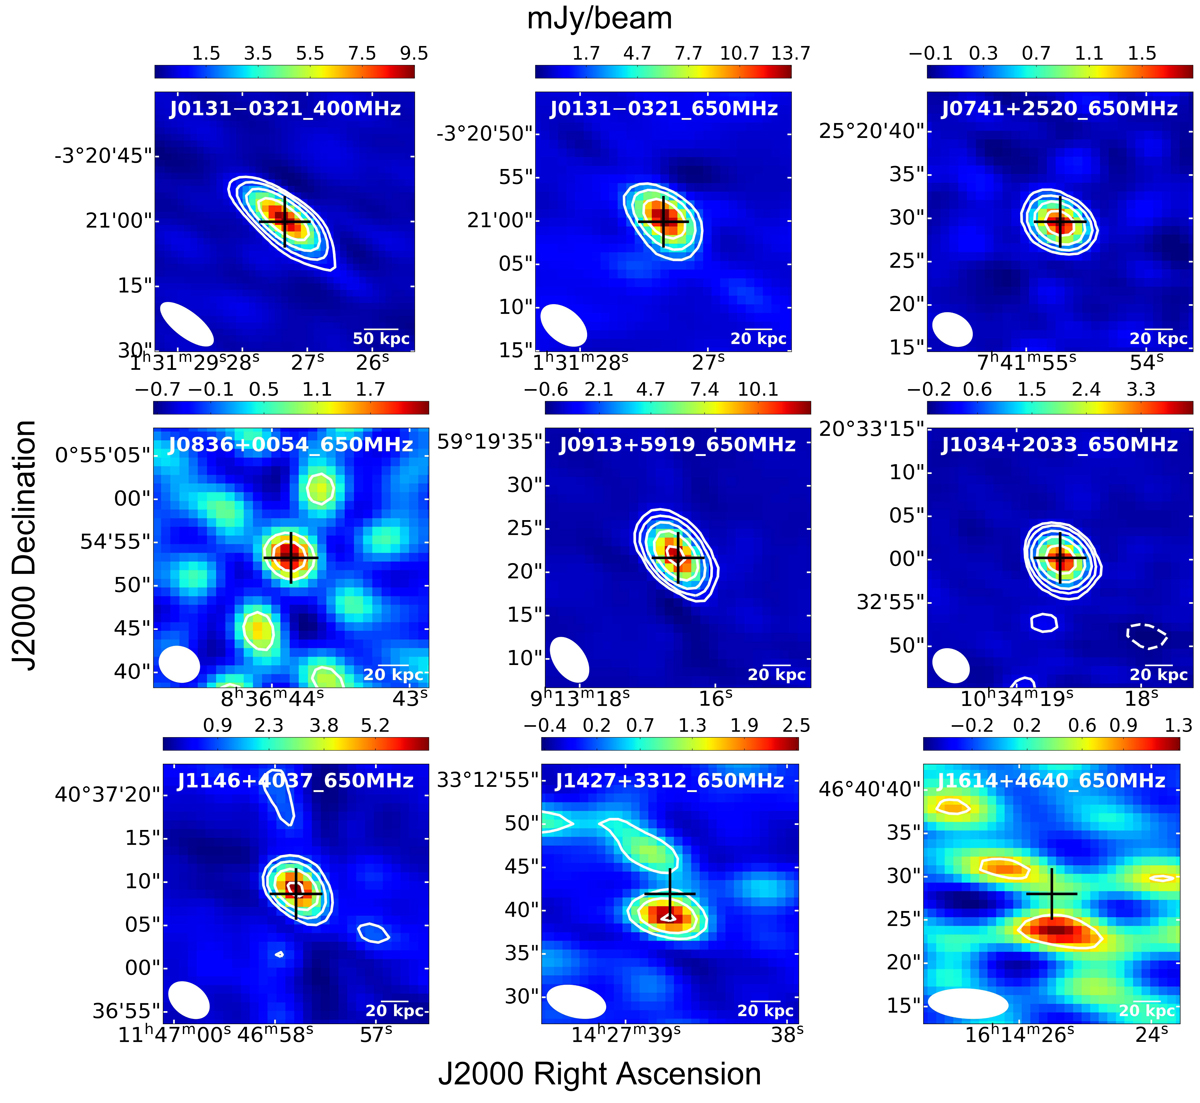
Fig. A.2.
Download original image
Continuum images from uGMRT. The top left panel shows the band-3 image of J0131−0321, and the rest are band-4 images. Each panel has an image size of 30″ × 30″. The black crosses are the published optical positions in McGreer et al. (2009) and SDSS; in the case of J0131−0321, J0836+0054, J0913+5919, J1146+4037, and J1427+3312, we use the positions from VLBA or EVN observations (Frey et al. 2003, 2010; Momjian et al. 2003, 2008; Gabányi et al. 2015). The shapes of the synthesized beams are plotted in the bottom left corner of each sub-figure. The beam size of each map and the flux density of each target are presented in Table 3. The contour levels are [−4, 4, 8, 16, 32, 64] × rms (the 1σ off-source noise level listed in Table 3).
Current usage metrics show cumulative count of Article Views (full-text article views including HTML views, PDF and ePub downloads, according to the available data) and Abstracts Views on Vision4Press platform.
Data correspond to usage on the plateform after 2015. The current usage metrics is available 48-96 hours after online publication and is updated daily on week days.
Initial download of the metrics may take a while.