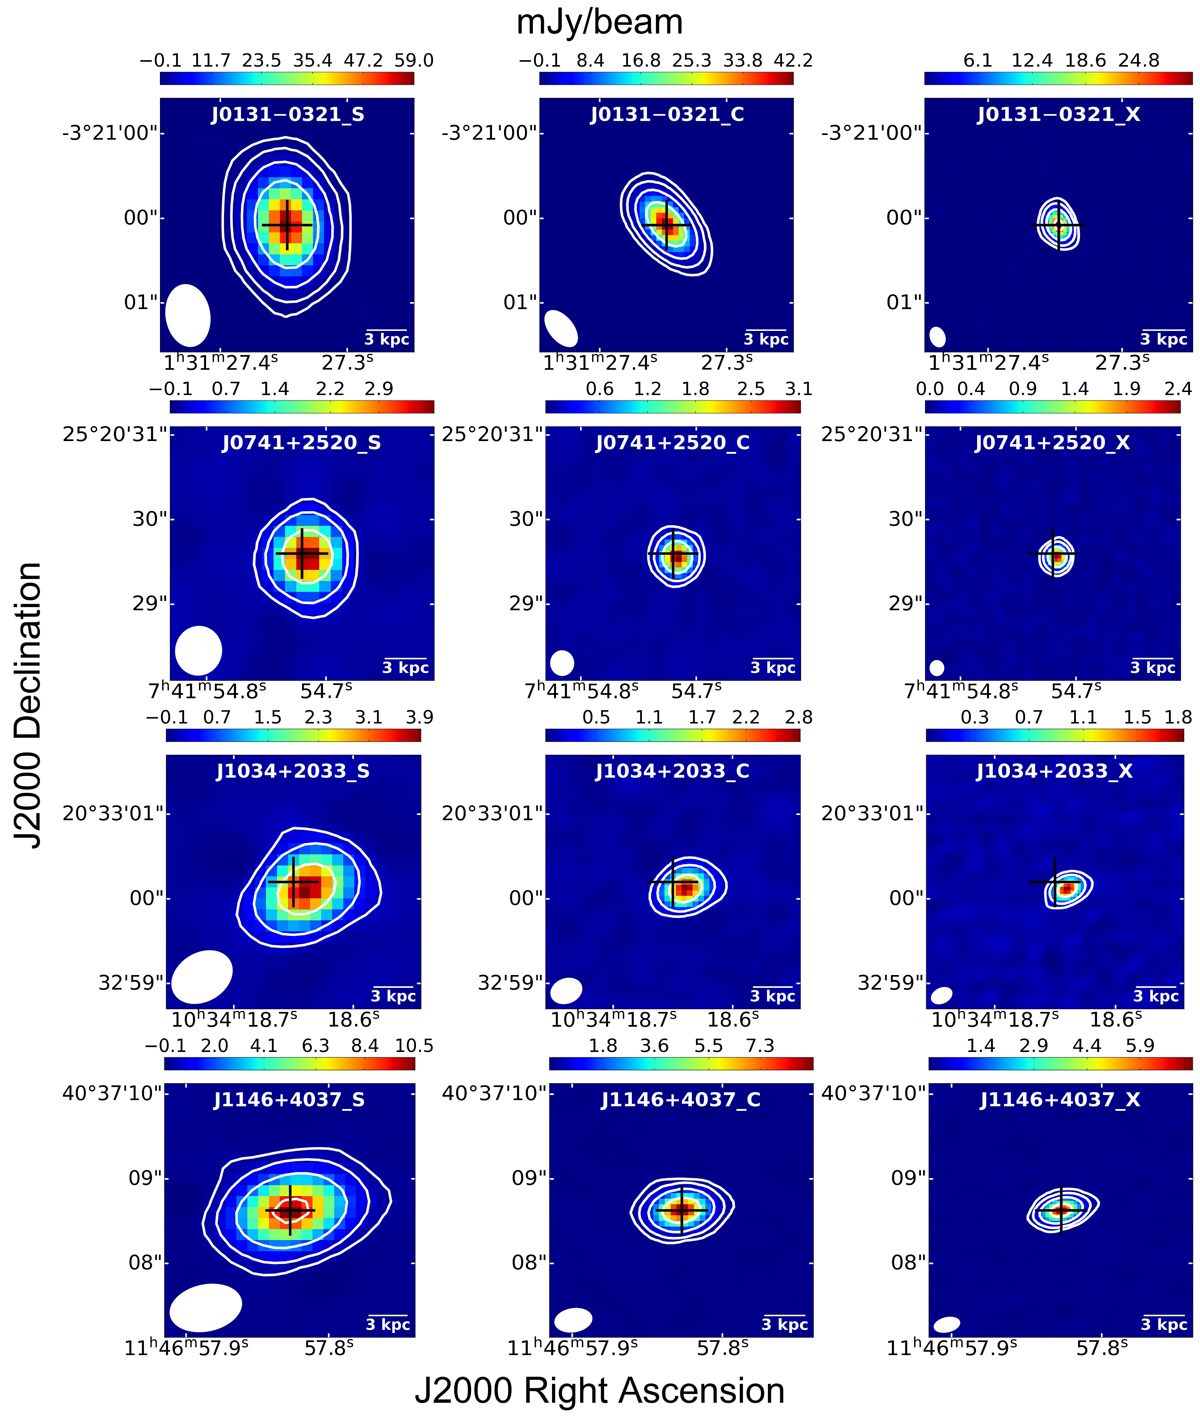
Fig. A.1.

Download original image
Continuum images from (left to right) the VLA S, C, and X bands. The three panels in each row present the VLA three-band images for one target. Each panel has an image size of 3″ × 3″. The black crosses mark the published optical positions (Sharp et al. 2001; McGreer et al. 2009; SDSS); in the case of J0131−0321, J1146+4037, and J2228+0110 we adopt the position from EVN observations (Frey et al. 2010; Cao et al. 2014; Gabányi et al. 2015). The shapes of the synthesized beams are plotted in the bottom left corner of each sub-figure. The beam sizes are presented in Table 2, where the flux density for each target is also listed. The contour levels are [−4, 4, 16, 64, 256, 1024] × rms (the 1σ off-source noise level listed in Table 2).
Current usage metrics show cumulative count of Article Views (full-text article views including HTML views, PDF and ePub downloads, according to the available data) and Abstracts Views on Vision4Press platform.
Data correspond to usage on the plateform after 2015. The current usage metrics is available 48-96 hours after online publication and is updated daily on week days.
Initial download of the metrics may take a while.


