Fig. 1.
Download original image
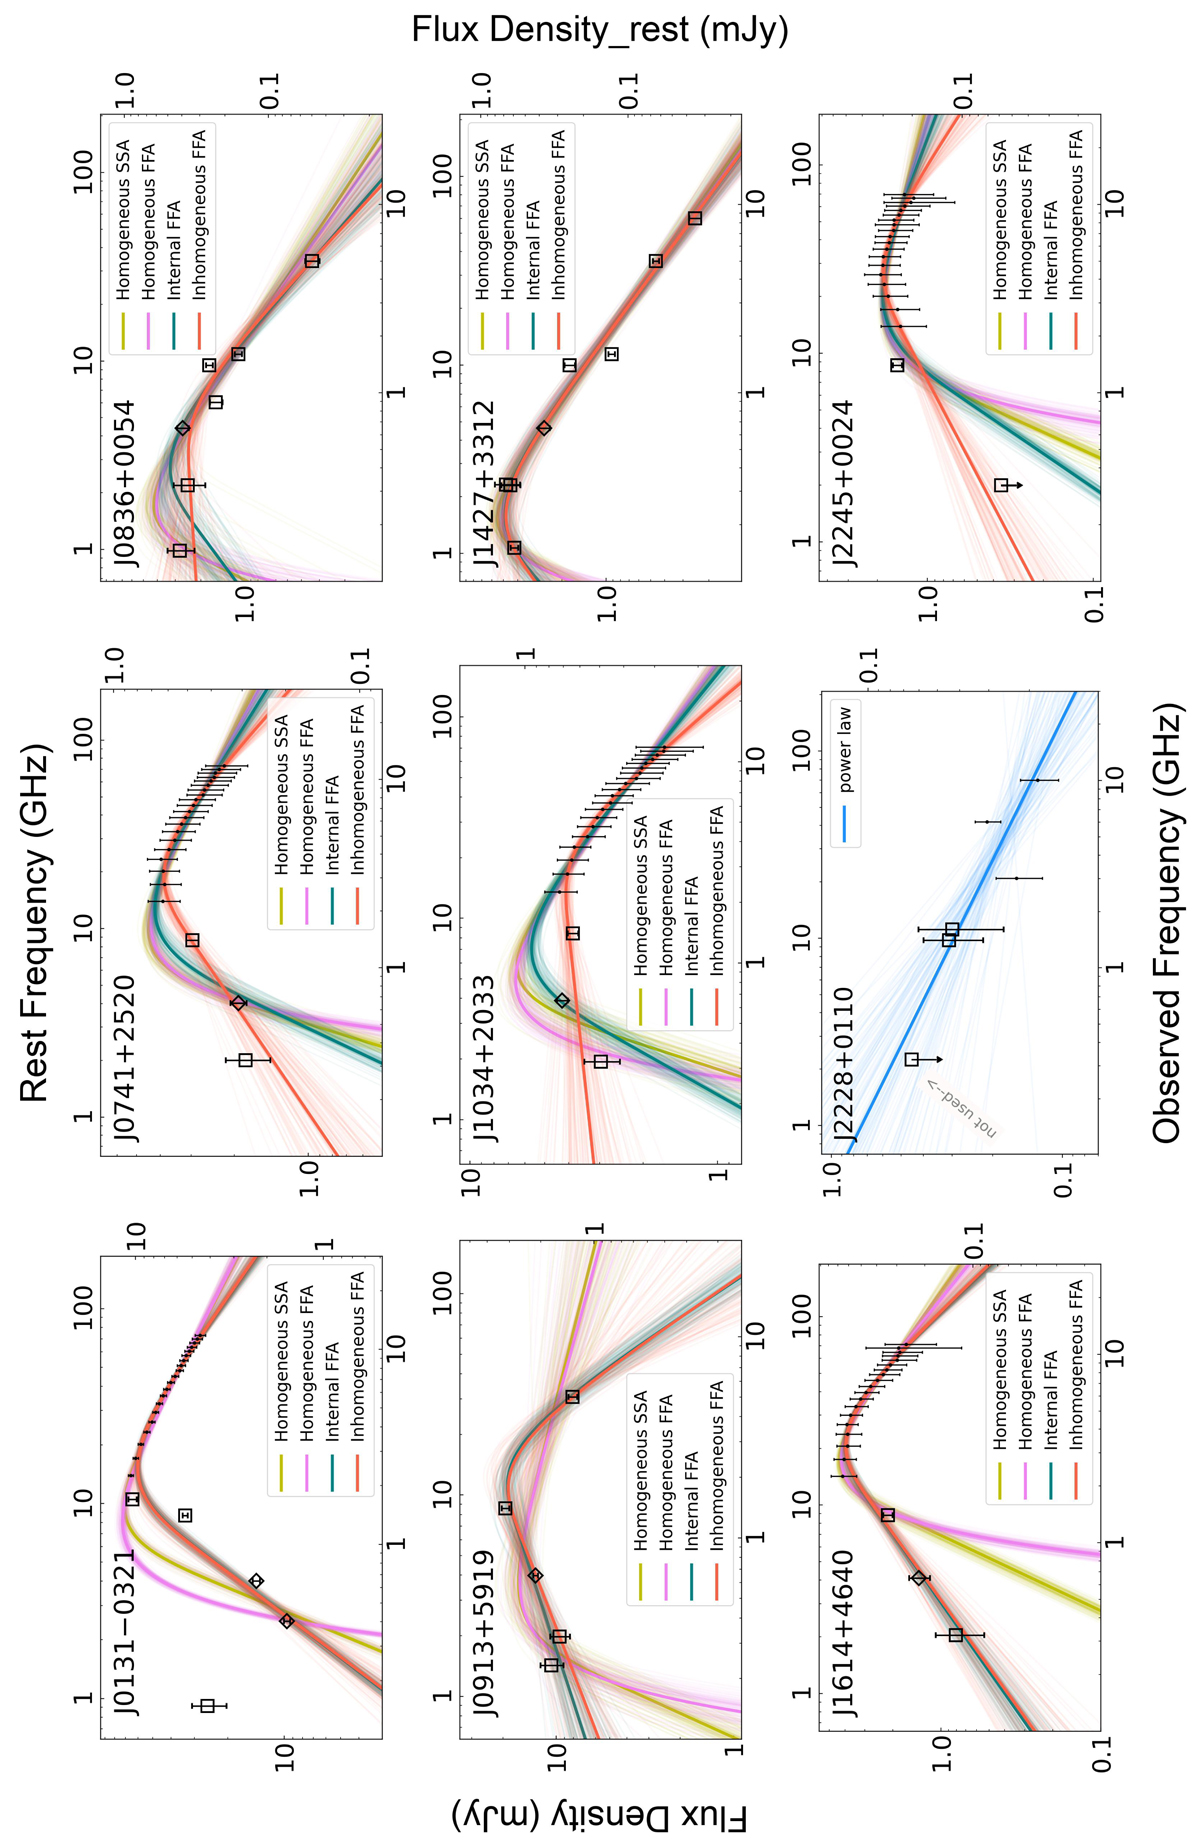
Spectral model fit for nine targets in our sample. The black open squares with error bars are archival data taken from the literature. The black points with error bars are VLA S-, C-, and X-band measurements. As the errors for the VLA S-, C-, and X-band observations are small, we used five times the uncertainties to make them more visible, except for J2228+0110. We note that we only present the measured flux densities for each observing band toward our targets in Table 2. The black open diamonds with error bars are uGMRT measurements, which can be seen in Table 3. We note that in Tables 2 and 3 we only list the fitting-type errors for each flux density. In the plot and model fitting we included 5% and 10% calibration errors for our new VLA and uGMRT data, respectively, and for the archival data we also added calibration errors. For all targets in this figure (except for J2228+0110), we fitted four absorption models – homogeneous SSA (yellow lines), homogeneous FFA (purple lines), internal FFA (green lines), and inhomogeneous FFA (red lines). The fitted results are presented in Table 4. For J2228+0110, the peak signature is not well constrained, and thus we only fit a power-law model (blue lines). And during this model fitting we only used detections, which reveals a flat power law with index of ![]() . During the fits, we employed the MCMC method and visualized the model uncertainties with shaded areas by randomly selecting 100 models from the parameter space.
. During the fits, we employed the MCMC method and visualized the model uncertainties with shaded areas by randomly selecting 100 models from the parameter space.
Current usage metrics show cumulative count of Article Views (full-text article views including HTML views, PDF and ePub downloads, according to the available data) and Abstracts Views on Vision4Press platform.
Data correspond to usage on the plateform after 2015. The current usage metrics is available 48-96 hours after online publication and is updated daily on week days.
Initial download of the metrics may take a while.