Fig. 7.
Download original image
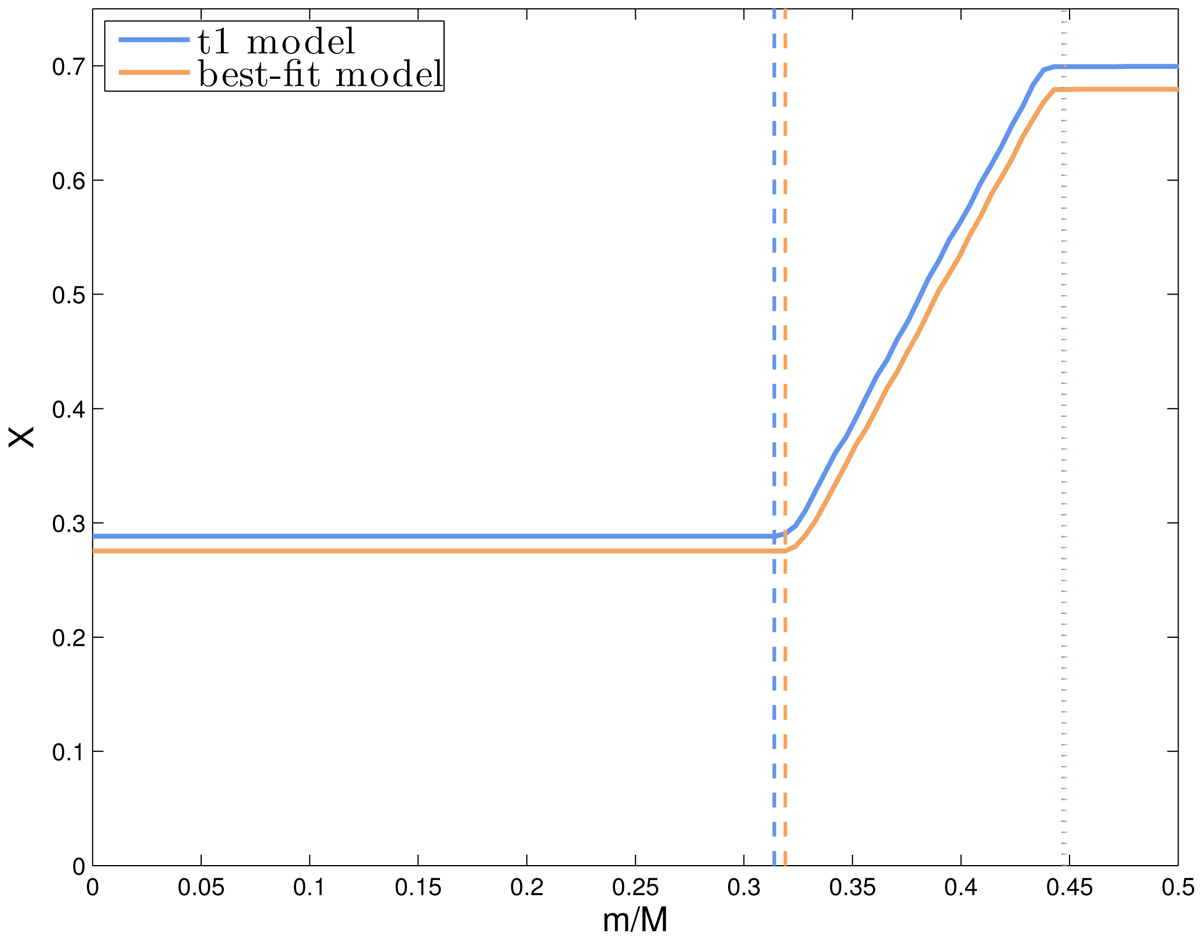
Profile of the hydrogen abundance, X, as a function of the normalised mass, for the target t1 model in blue and the best-fit model of the t1-asp-5freq (and t1-asp-4freq) exercise in orange. The vertical dashed lines indicate the limits of the fully mixed central region (i.e. including the overshoot region) of the two models, with the same colour association than the X profile. The vertical dotted lines are similarly colour-coded and indicate the limits of the gradient of chemical composition.
Current usage metrics show cumulative count of Article Views (full-text article views including HTML views, PDF and ePub downloads, according to the available data) and Abstracts Views on Vision4Press platform.
Data correspond to usage on the plateform after 2015. The current usage metrics is available 48-96 hours after online publication and is updated daily on week days.
Initial download of the metrics may take a while.