Fig. 5.
Download original image
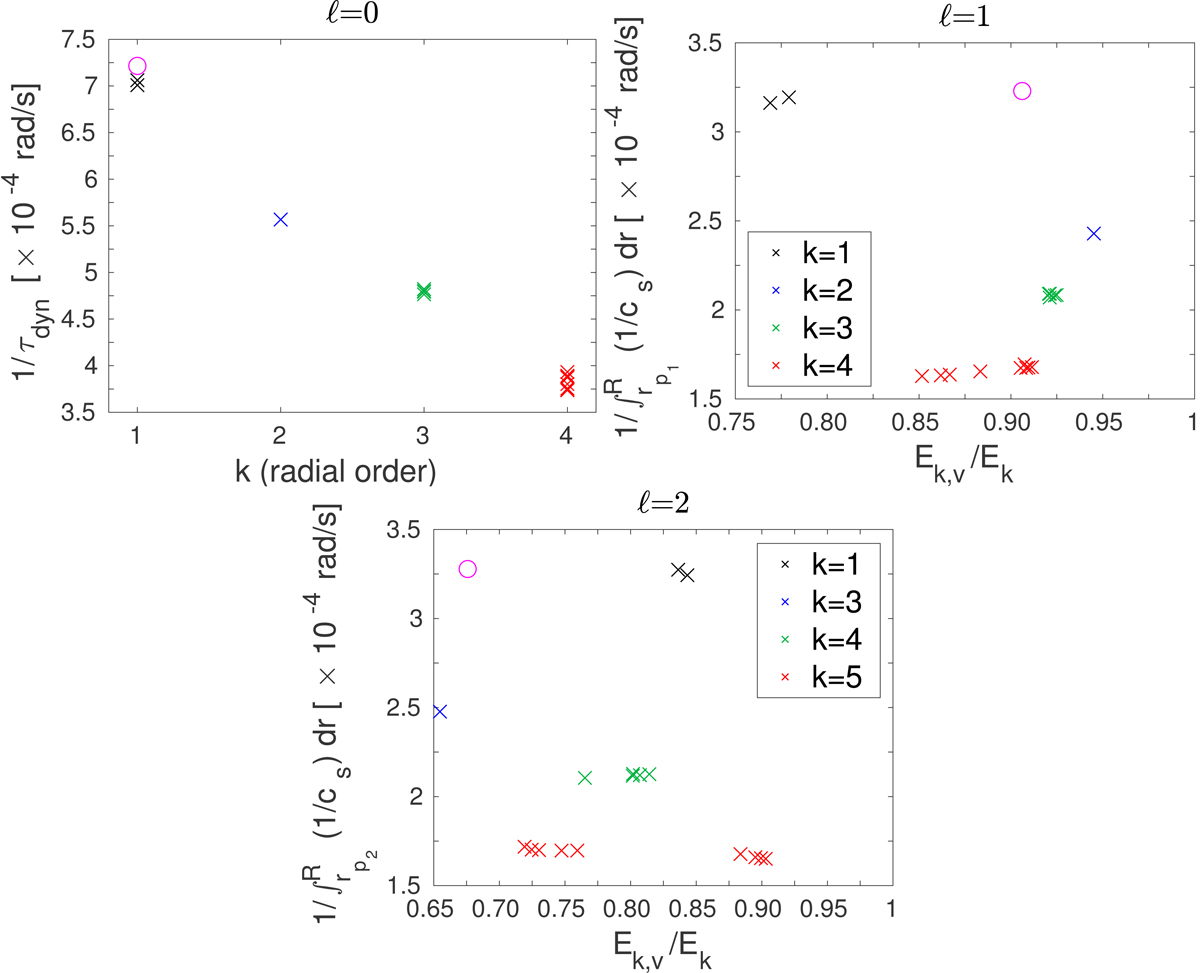
Results of the MC simulations for the t1-asp-3freq test. We select a sample of 20 models presenting similar values of χ2 as the global minimum. Top left panel: inverse of the dynamical timescale as a function of the radial order of the ℓ0 modes (in the 20 models described above) that best fit the original ℓ0 mode of the t1-asp-3freq input frequency set. Top right panel: ![]() as a function of Ek, v/Ek for the ℓ1 modes that best fit the original ℓ1 mode of the t1-asp-3freq frequency in the selected models. The colour index represents the radial order of the fitting ℓ1 modes. Bottom panel: same as in the top right panel, but now adapted for the ℓ2 modes. The case of the input t1 model is represented in each panel by an open magenta circle.
as a function of Ek, v/Ek for the ℓ1 modes that best fit the original ℓ1 mode of the t1-asp-3freq frequency in the selected models. The colour index represents the radial order of the fitting ℓ1 modes. Bottom panel: same as in the top right panel, but now adapted for the ℓ2 modes. The case of the input t1 model is represented in each panel by an open magenta circle.
Current usage metrics show cumulative count of Article Views (full-text article views including HTML views, PDF and ePub downloads, according to the available data) and Abstracts Views on Vision4Press platform.
Data correspond to usage on the plateform after 2015. The current usage metrics is available 48-96 hours after online publication and is updated daily on week days.
Initial download of the metrics may take a while.