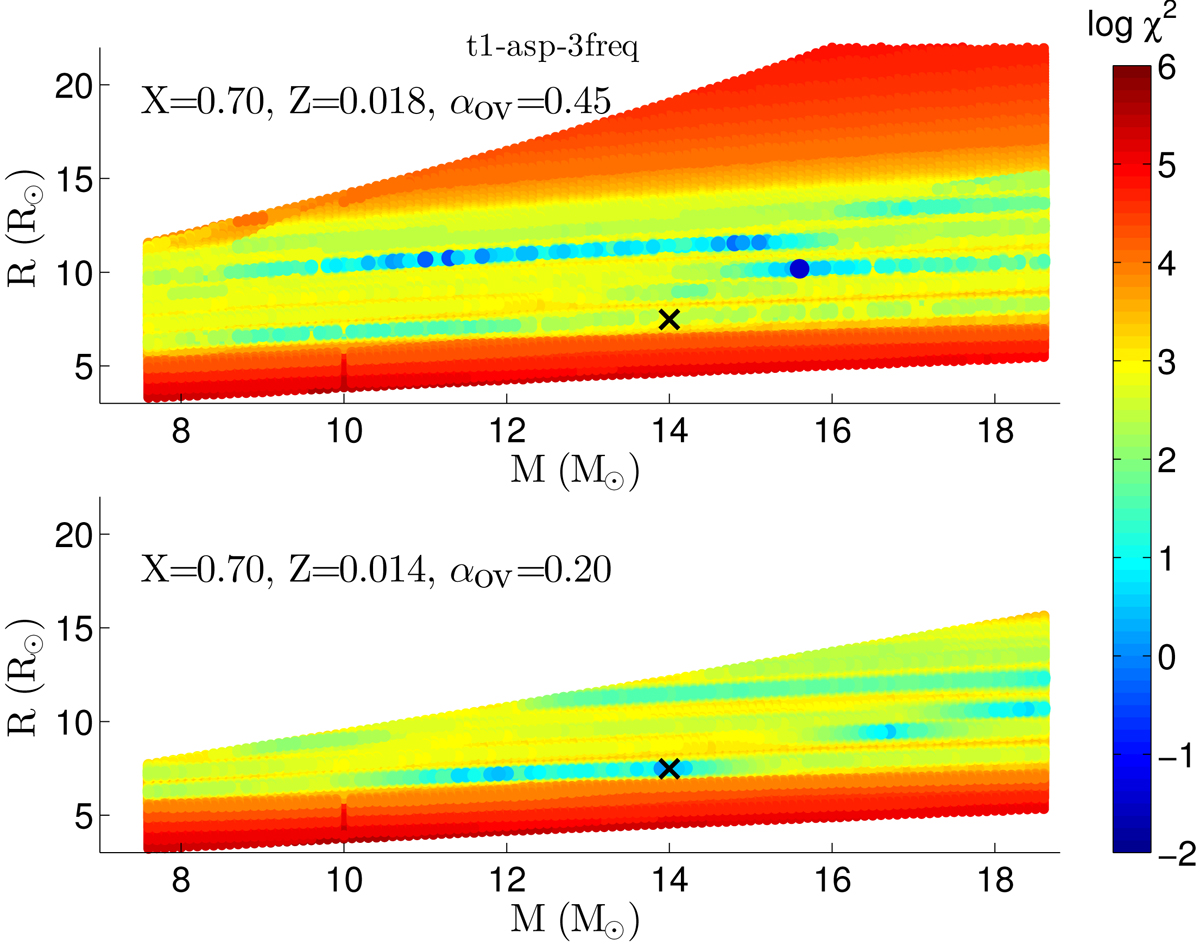
Fig. 3.
Download original image
Values of log χ2 for the input frequencies of the t1-asp-3freq exercise are represented with a colour map (see legend in the figure for the related scale) in the M − R plane of the grid of models. The chemical composition and overshooting (X, Z, αov) are those of the χ2 global minimum in the top panel and those of the input model t1 in the bottom panel. A cross symbol is located at the real position of the t1 model.
Current usage metrics show cumulative count of Article Views (full-text article views including HTML views, PDF and ePub downloads, according to the available data) and Abstracts Views on Vision4Press platform.
Data correspond to usage on the plateform after 2015. The current usage metrics is available 48-96 hours after online publication and is updated daily on week days.
Initial download of the metrics may take a while.