Fig. 7
Download original image
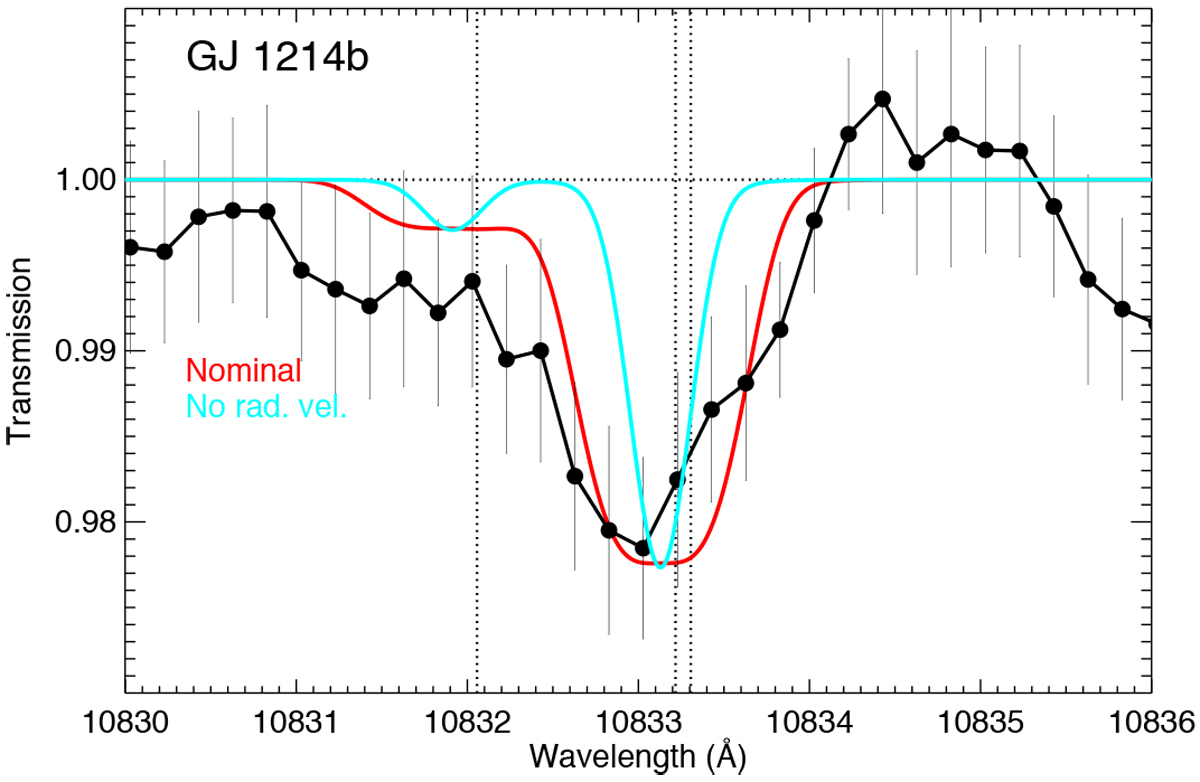
Phase-averaged transmission spectrum (from T1 to T4 contacts) of the He I triplet during transit. Measured absorption (dots), and their respective estimated errors are shown in black (as in the bottom left panel of Fig. 2), but with a two-point running mean applied (The spectrum has been smoothed for illustration purposes. In the fitting analysis, the original values and errors (light grey bars in the left/bottom panel of Fig. 2) were used.). The cyan curve shows the absorption profile when only the Doppler and turbulence broadening are included. The red curve isthe profile of one of the best-fit models obtained for an effective temperature of 3600 K, a mass-loss rate (Ṁ) of 5.9 × 10¹⁰ g s−1, and an H/He mole-fraction ratio of 98/2. This absorption also includes the broadening induced by the radial velocities of the model and a blue net wind of − 4 km s−1. The positions of the three He I lines are marked by vertical dotted lines.
Current usage metrics show cumulative count of Article Views (full-text article views including HTML views, PDF and ePub downloads, according to the available data) and Abstracts Views on Vision4Press platform.
Data correspond to usage on the plateform after 2015. The current usage metrics is available 48-96 hours after online publication and is updated daily on week days.
Initial download of the metrics may take a while.