Fig. 5
Download original image
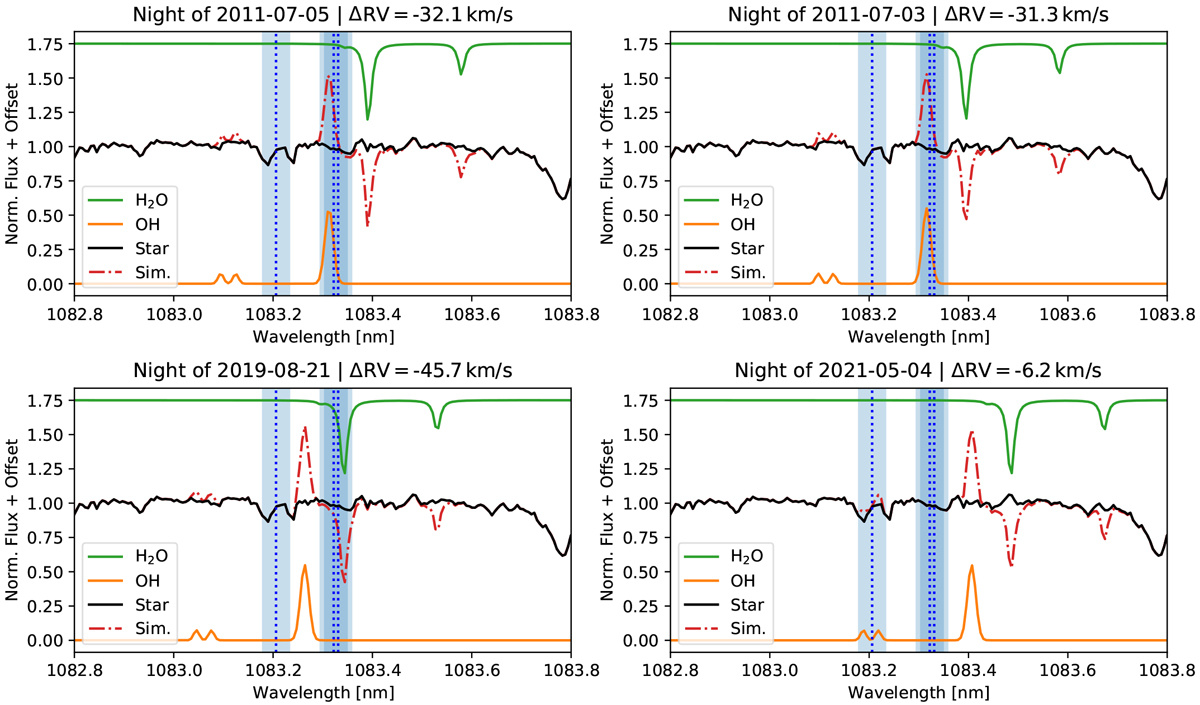
Simulation of the contamination of the spectrum of GJ 1214 by H2O absorption and OH emission during the nights corresponding to the observations by Petit dit de la Roche et al. (2020) (2011 July 5, 2011 July 3), Kasper et al. (2020) (2019 August 21), and this work (2021 May 4). Observing epoch and relative radial velocity between the Earth and GJ 1214 (ΔRV) are displayed above each panel. The green curve is a synthetic model of H2O absorption. The orange curve is a synthetic model of OH emission. The black curve is the average of normalised out-of-transit GJ 1214 spectra. The dashed red line is the combination of synthetic telluric models and the spectrum of GJ 1214. The vertical blue dotted lines indicate the position of the He I triplet lines and the blue shaded region represents the planet trace in the stellar rest frame at vacuum wavelength. We note that He I lines and H2O telluric absorption positions differ between this figure and Fig. 2 from Kasper et al. (2020) due to an error in their plot (D. Kasper, priv. comm.).
Current usage metrics show cumulative count of Article Views (full-text article views including HTML views, PDF and ePub downloads, according to the available data) and Abstracts Views on Vision4Press platform.
Data correspond to usage on the plateform after 2015. The current usage metrics is available 48-96 hours after online publication and is updated daily on week days.
Initial download of the metrics may take a while.