Fig. 4
Download original image
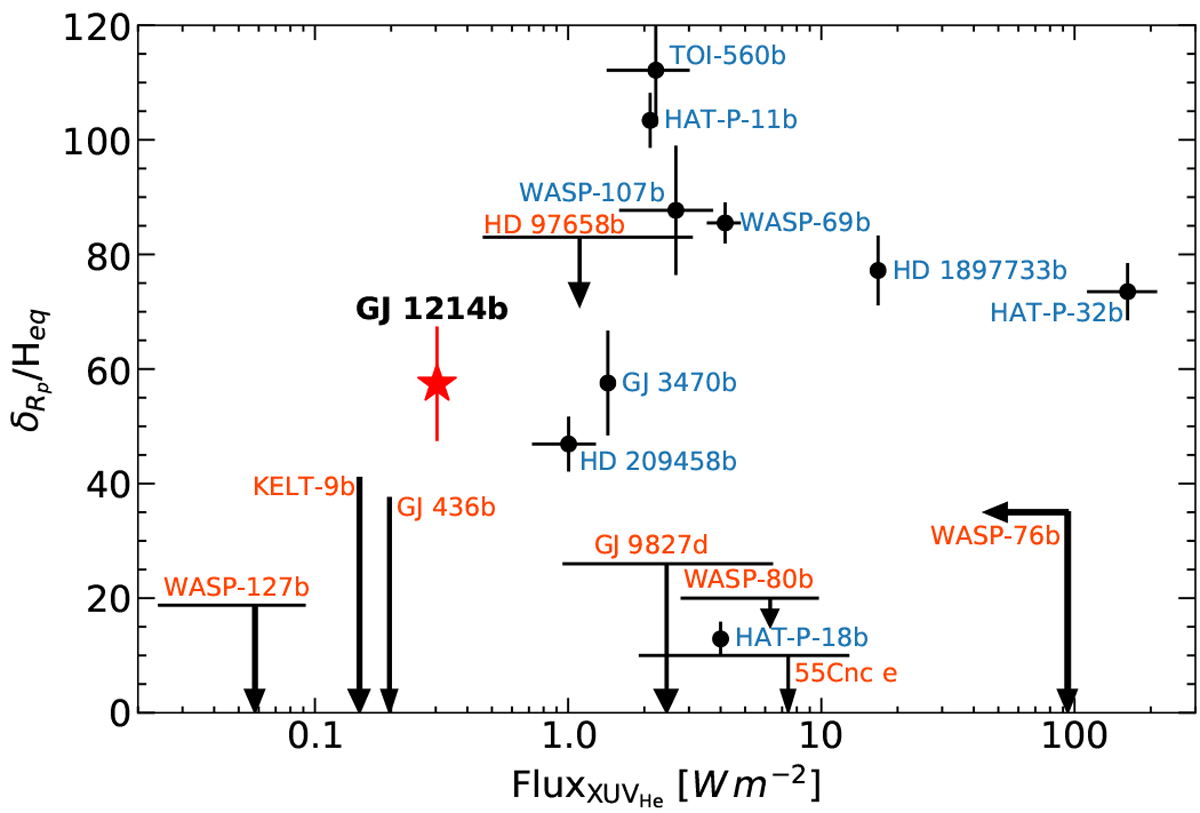
Transmission signals for the planets with He I detections (black dots with error bars labelled in blue) and some planets with upper limits (black arrows labelled in orange), as a function of the stellar
![]() (λ = 5–504 Å) at the planet distance. TOI-560 b, WASP-80 b, and 55 Cnc e flux values were computed up to
λ ~ 912 Å. We show the equivalent height of the He I atmosphere,
(λ = 5–504 Å) at the planet distance. TOI-560 b, WASP-80 b, and 55 Cnc e flux values were computed up to
λ ~ 912 Å. We show the equivalent height of the He I atmosphere, ![]() , normalised by the atmospheric scale height, Heq, of the respective planet. The red star is the results presented here on GJ 1214 b. Data on other planets are from Nortmann et al. (2018); Alonso-Floriano et al. (2019); Palle et al. (2020); Kasper et al. (2020); dos Santos et al. (2020); Paragas et al. (2021); Casasayas-Barris et al. (2021); Zhang et al. (2021, 2022); Fossati et al. (2022); Czesla et al. (2022).
, normalised by the atmospheric scale height, Heq, of the respective planet. The red star is the results presented here on GJ 1214 b. Data on other planets are from Nortmann et al. (2018); Alonso-Floriano et al. (2019); Palle et al. (2020); Kasper et al. (2020); dos Santos et al. (2020); Paragas et al. (2021); Casasayas-Barris et al. (2021); Zhang et al. (2021, 2022); Fossati et al. (2022); Czesla et al. (2022).
Current usage metrics show cumulative count of Article Views (full-text article views including HTML views, PDF and ePub downloads, according to the available data) and Abstracts Views on Vision4Press platform.
Data correspond to usage on the plateform after 2015. The current usage metrics is available 48-96 hours after online publication and is updated daily on week days.
Initial download of the metrics may take a while.