Fig. 1
Download original image
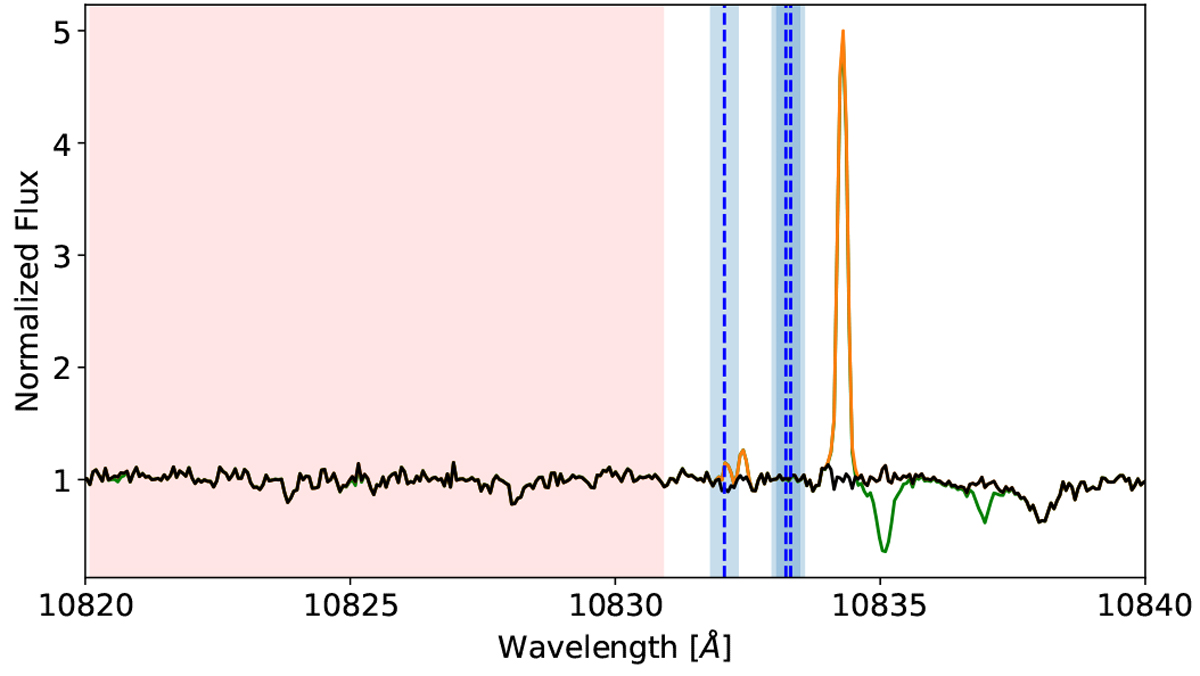
Details of one CARMENES spectrum of GJ 1214 around the He I triplet lines. A raw spectrum after standard data reduction is plotted in green. The same spectrum after the telluric correction with molecfit is over-plotted in orange. The same spectrum after removing the OH emission features is over-plotted in black. The red shaded region is the spectral range used to normalise the continuum of all spectra. The vertical blue dashed lines indicate the position at mid-transit of He I triplet lines and the blue shaded regions represent the planet traces during the transit. All the spectra are shifted to the stellar rest frame at vacuum wavelength.
Current usage metrics show cumulative count of Article Views (full-text article views including HTML views, PDF and ePub downloads, according to the available data) and Abstracts Views on Vision4Press platform.
Data correspond to usage on the plateform after 2015. The current usage metrics is available 48-96 hours after online publication and is updated daily on week days.
Initial download of the metrics may take a while.