Fig. 3
Download original image
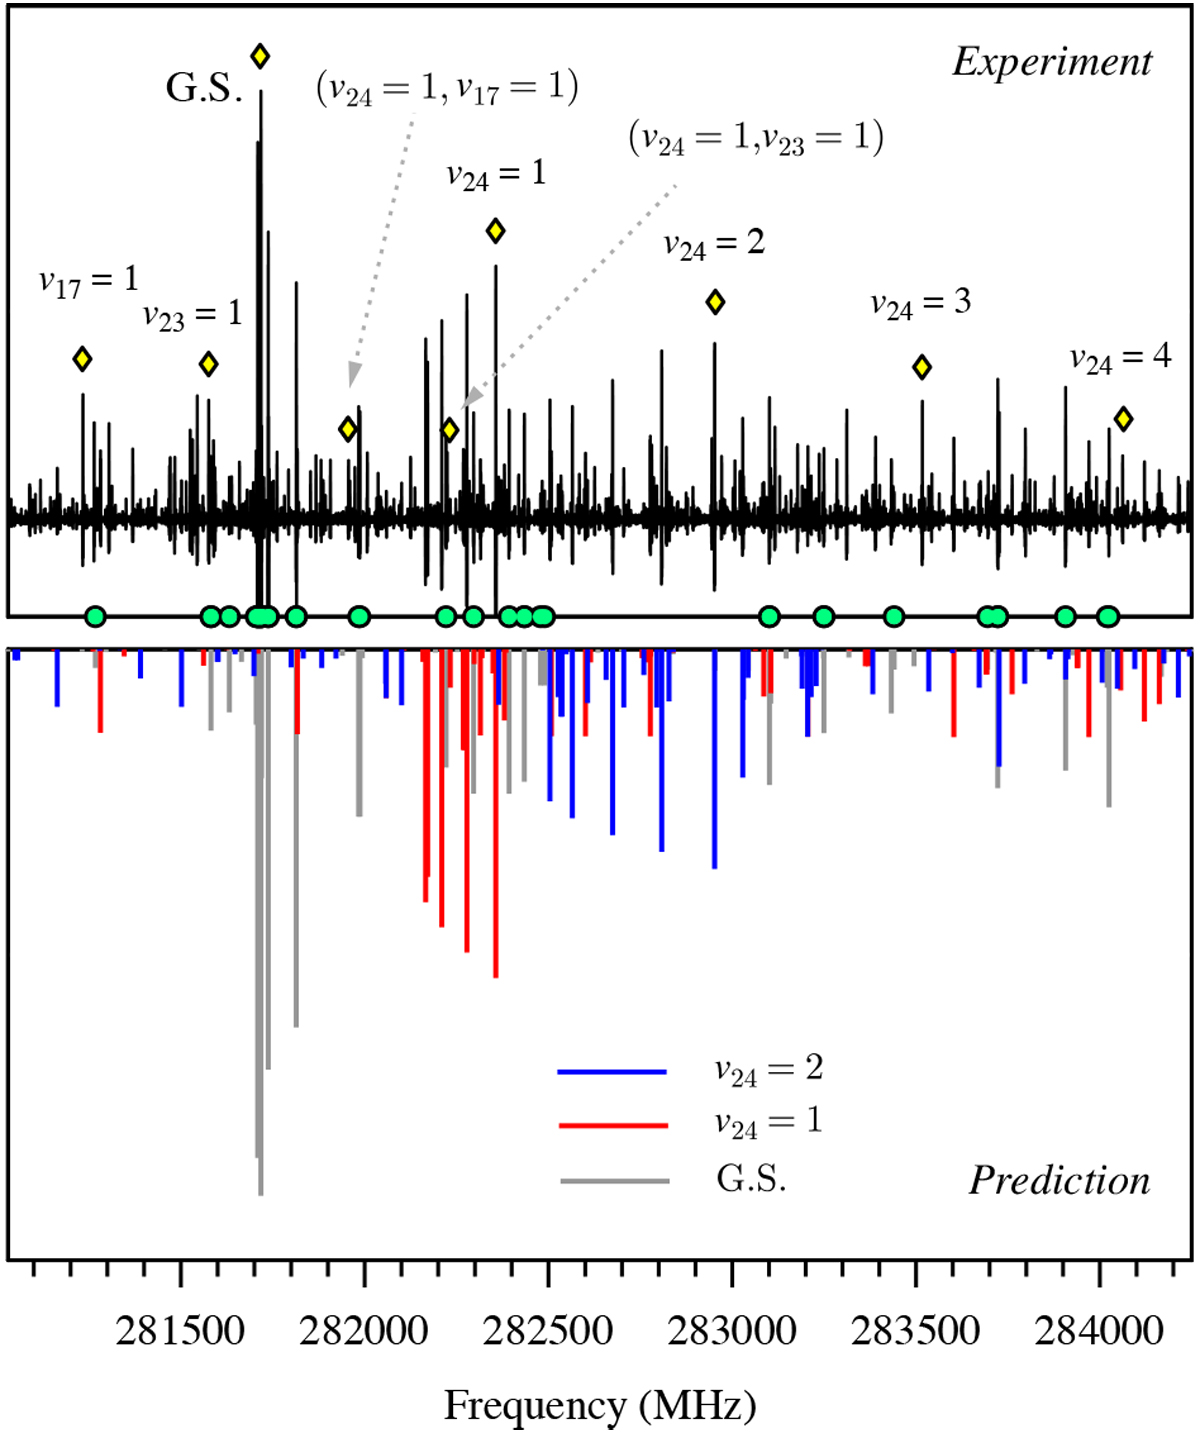
Vibrational satellite pattern of the syn conformer in the millimeter wave spectrum of acrylamide. The upper panel shows a pair of degenerate 46 1, 46 ← 45 0, 45 and 46 0, 46 ← 45 1, 45 transitions for the ground state (G.S.) and the excited vibrational states (yellow diamonds). The green circle symbols represent the ground state lines included in the fit. The lower panel illustrates a stick reproduction of the ground state and v24 = 1, 2 spectra using the spectroscopic constants from Table 1.
Current usage metrics show cumulative count of Article Views (full-text article views including HTML views, PDF and ePub downloads, according to the available data) and Abstracts Views on Vision4Press platform.
Data correspond to usage on the plateform after 2015. The current usage metrics is available 48-96 hours after online publication and is updated daily on week days.
Initial download of the metrics may take a while.