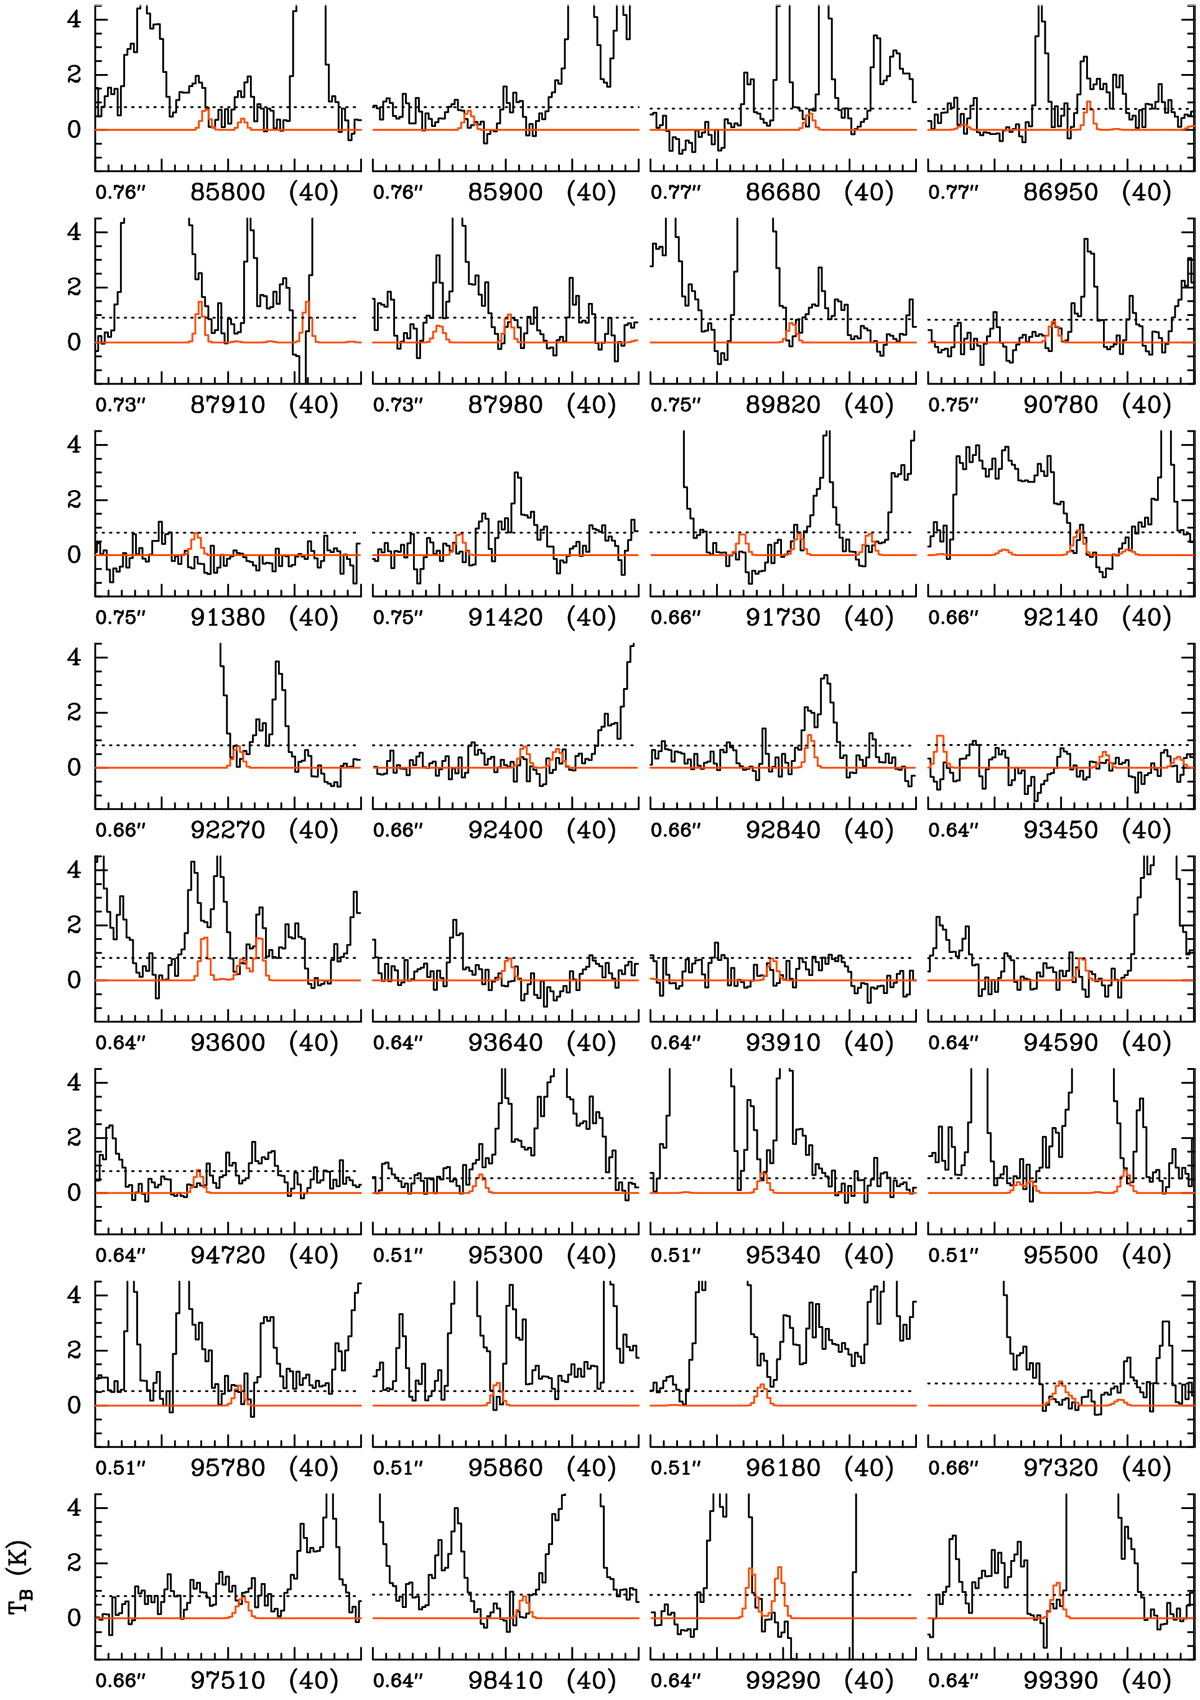
Fig. B.9
Download original image
Selection of transitions of propionamide, C2H5C(O)NH2, v = 0 covered by the ReMoCA survey. The synthetic spectrum of C2H5C(O)NH2, v = 0 used to derive the upper limit to its column density is displayed in red and overlaidon the black spectrum observed toward the equatorial offset position (1.58′′, −2.72′′) relative to the phase center. The central frequency and width are indicated in MHz below each panel. The angular resolution (HPBW) is also indicated. The y-axis is labeled in brightness temperature units (K). The dotted line indicates the 3σ noise level.
Current usage metrics show cumulative count of Article Views (full-text article views including HTML views, PDF and ePub downloads, according to the available data) and Abstracts Views on Vision4Press platform.
Data correspond to usage on the plateform after 2015. The current usage metrics is available 48-96 hours after online publication and is updated daily on week days.
Initial download of the metrics may take a while.