Fig. 5
Download original image
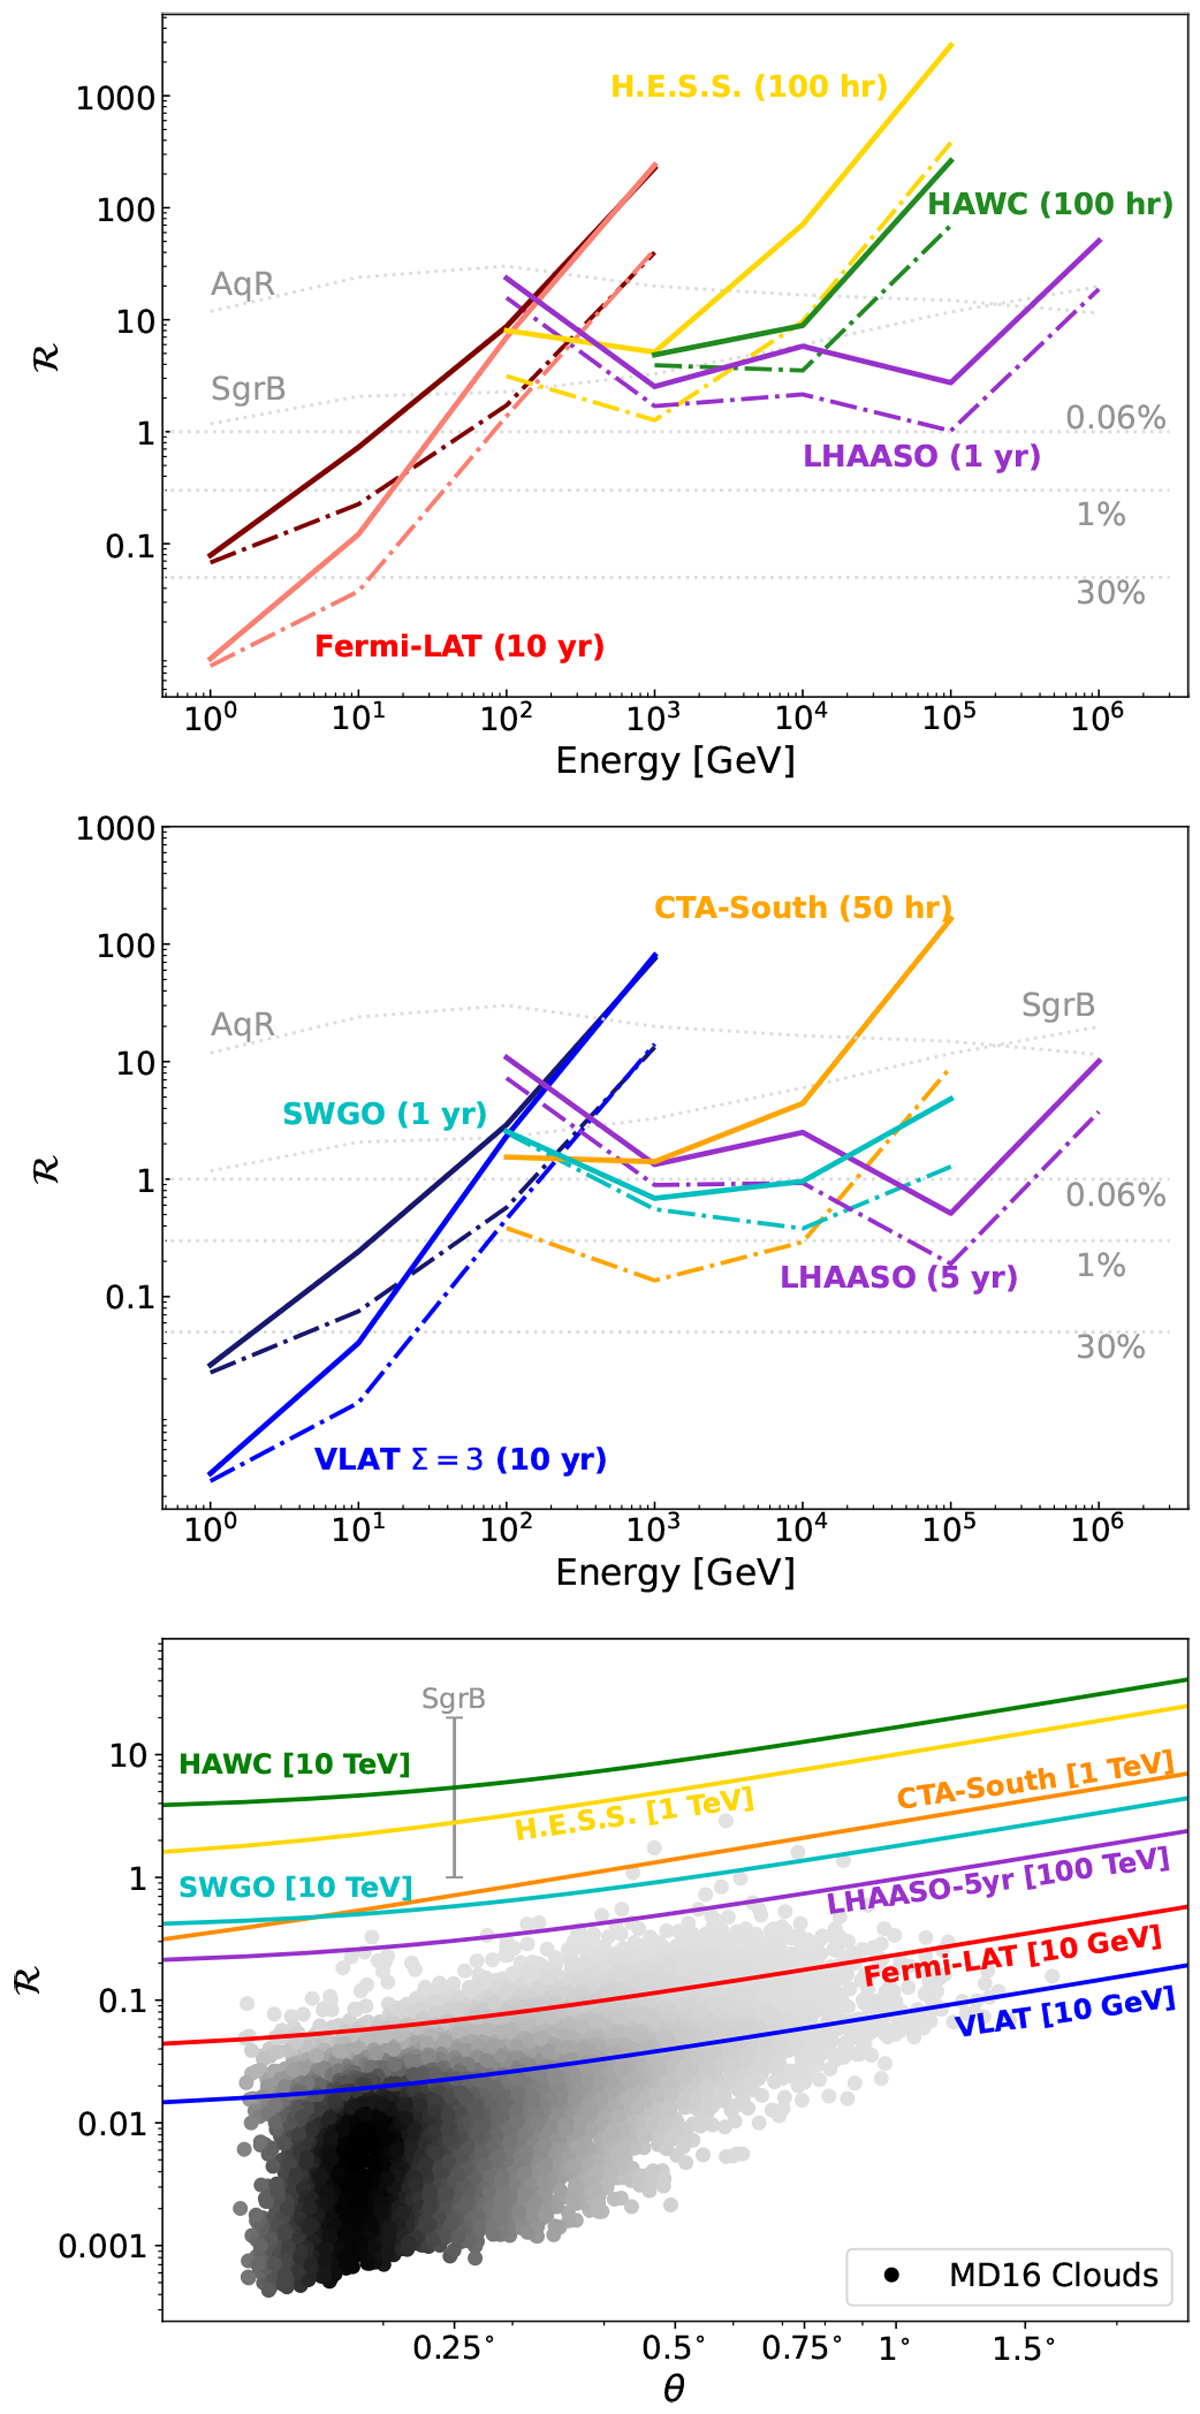
![]() values calculated for the current (uppermost panel) and next-generation (middle panel) instruments, for different exposure times as functions of energy and of the angular extension (lowermost panel). In the two upper plots, the curves refer to the point-source hypothesis (dash-dotted lines) and to a 0.5°-wide source (solid lines). The percentage of the MD16 clouds that overcome an
values calculated for the current (uppermost panel) and next-generation (middle panel) instruments, for different exposure times as functions of energy and of the angular extension (lowermost panel). In the two upper plots, the curves refer to the point-source hypothesis (dash-dotted lines) and to a 0.5°-wide source (solid lines). The percentage of the MD16 clouds that overcome an
![]() value of 0.05, 0.3, and 1, assuming the local CR spectrum, is indicated in the figure. As a reference, the
value of 0.05, 0.3, and 1, assuming the local CR spectrum, is indicated in the figure. As a reference, the
![]() values of Aquila rift (AqR) and Sagittarius B2 (SgrB) are also plotted. Those were computed from the spectra reported in Baghmanyan et al. (2020) and Aharonian et al. (2020), respectively. In the lowermost panel, the physical properties (A, θ) of the MCsof the MD16 catalog are compared to the detection thresholds of the considered gamma instruments,
values of Aquila rift (AqR) and Sagittarius B2 (SgrB) are also plotted. Those were computed from the spectra reported in Baghmanyan et al. (2020) and Aharonian et al. (2020), respectively. In the lowermost panel, the physical properties (A, θ) of the MCsof the MD16 catalog are compared to the detection thresholds of the considered gamma instruments,
![]() (see Eq. (7)). The same exposure as in the upper panels is assumed.
(see Eq. (7)). The same exposure as in the upper panels is assumed.
Current usage metrics show cumulative count of Article Views (full-text article views including HTML views, PDF and ePub downloads, according to the available data) and Abstracts Views on Vision4Press platform.
Data correspond to usage on the plateform after 2015. The current usage metrics is available 48-96 hours after online publication and is updated daily on week days.
Initial download of the metrics may take a while.