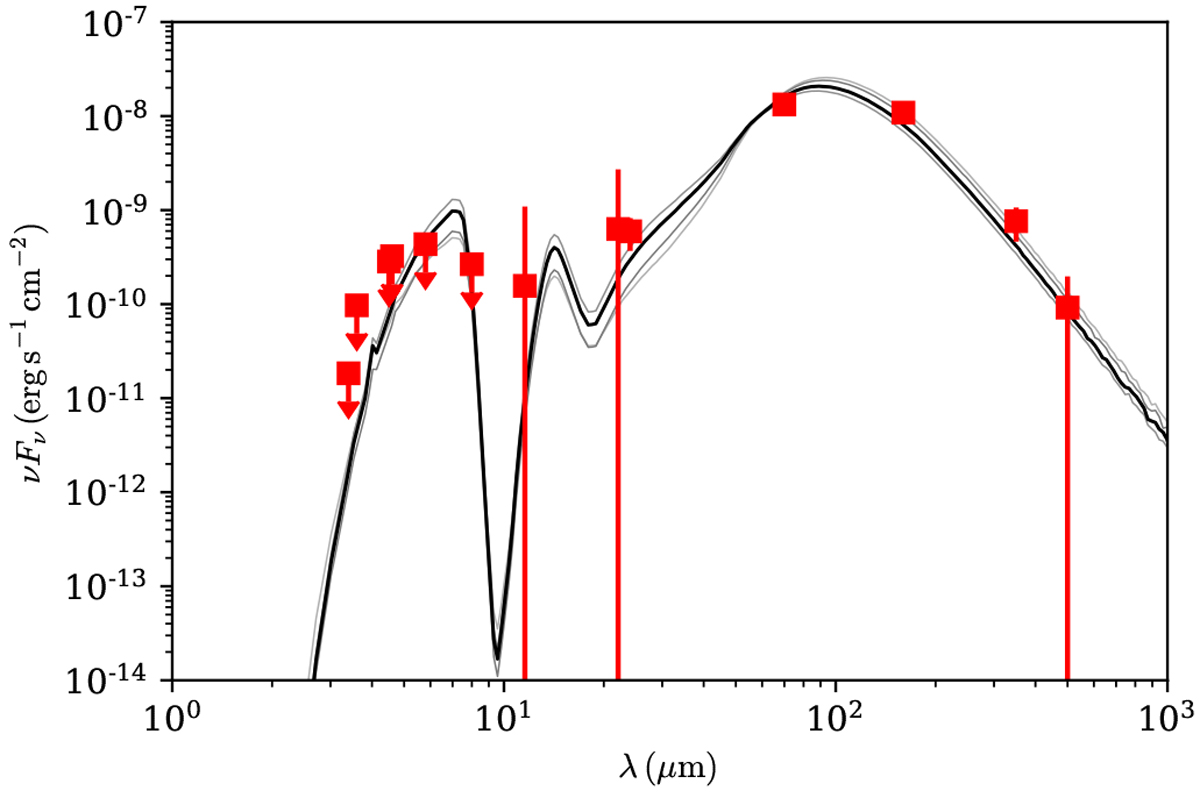
Fig. 9
Download original image
Spectral energy distribution (SED) model results from core accretion radiative transfer models of Zhang & Tan (2018) for IRAS 18264-1152. The best five SED models are shown in grey scale with the best model represented with the black line (see Table 4) while observations are shown as red squares with the down arrow indicating upper limits(see Table E.1).
Current usage metrics show cumulative count of Article Views (full-text article views including HTML views, PDF and ePub downloads, according to the available data) and Abstracts Views on Vision4Press platform.
Data correspond to usage on the plateform after 2015. The current usage metrics is available 48-96 hours after online publication and is updated daily on week days.
Initial download of the metrics may take a while.