Free Access
Fig. 7
Download original image
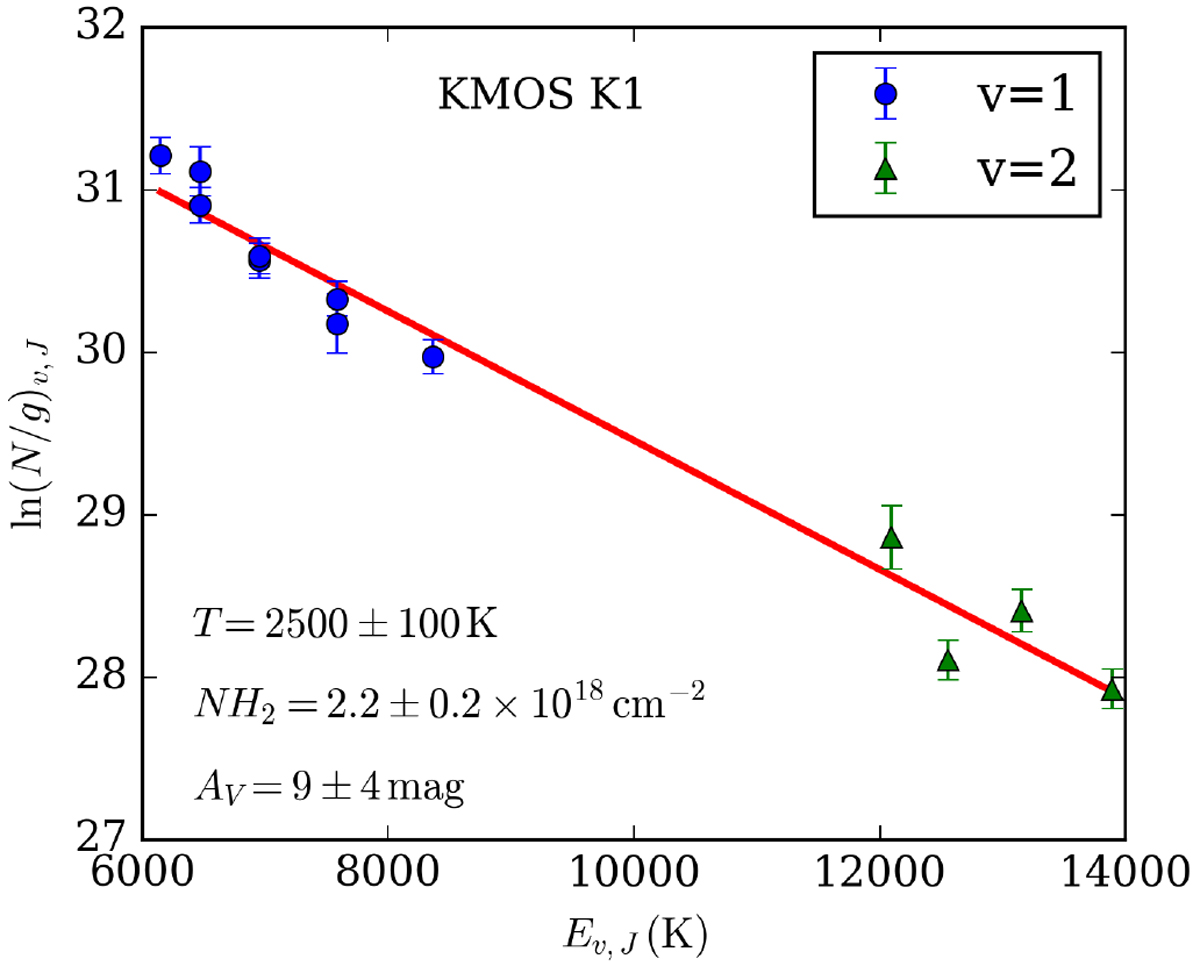
Ro-vibrational diagram for the integrated line fluxes of H2 lines from knot K1. The plot is fitted to yield estimates of H2 temperature and H2 column density. Thero-vibrational diagrams for the remaining knots can be found in Appendix D.
Current usage metrics show cumulative count of Article Views (full-text article views including HTML views, PDF and ePub downloads, according to the available data) and Abstracts Views on Vision4Press platform.
Data correspond to usage on the plateform after 2015. The current usage metrics is available 48-96 hours after online publication and is updated daily on week days.
Initial download of the metrics may take a while.