Fig. 4
Download original image
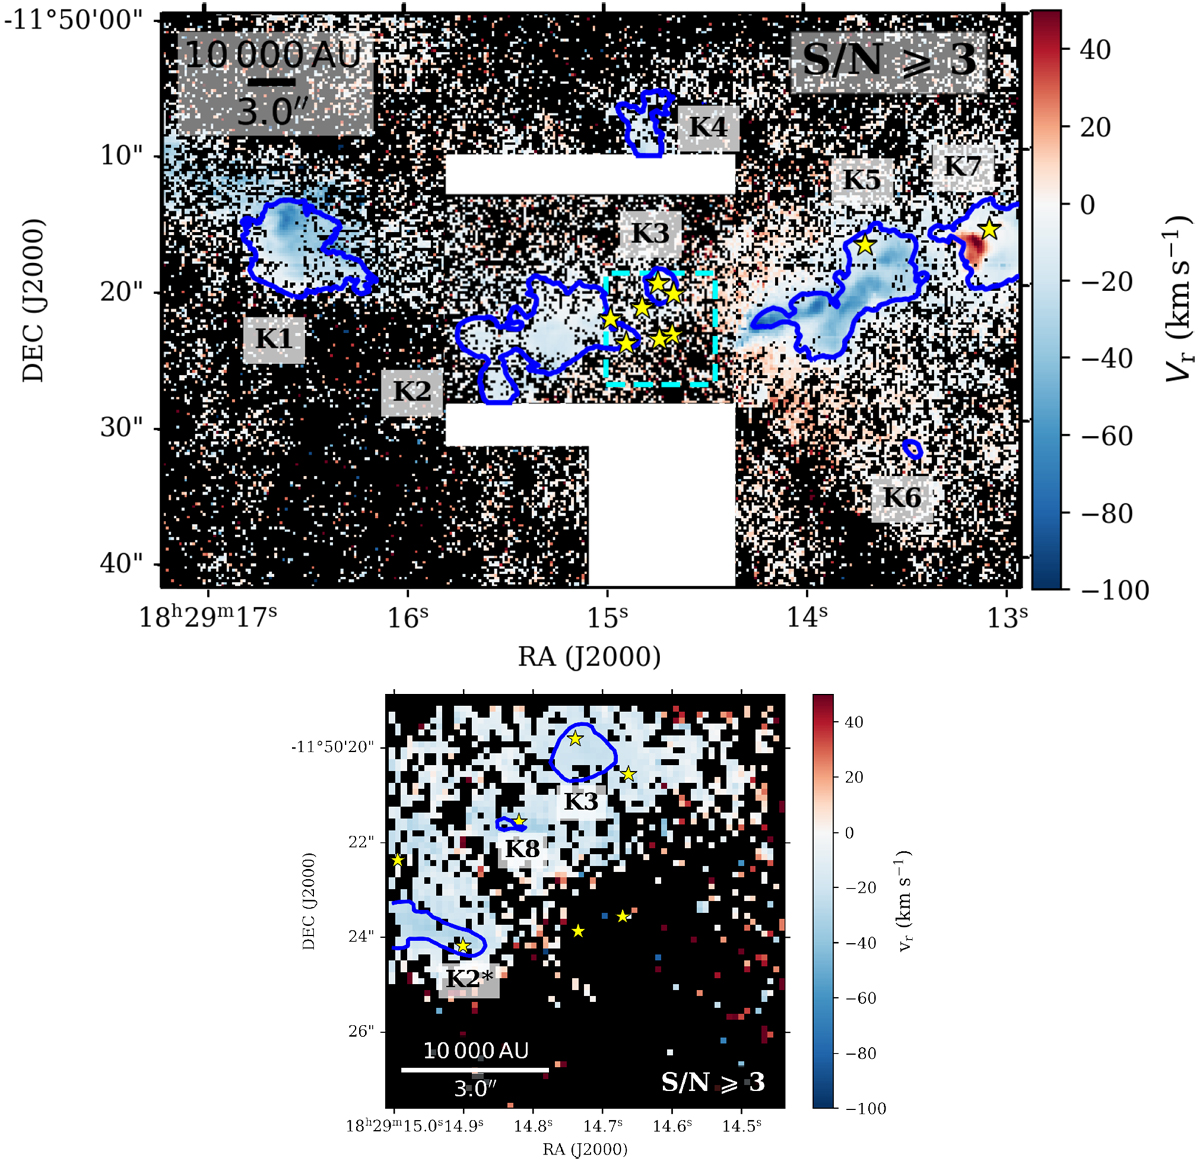
Radial velocity (vr) maps obtained via measuring the Doppler shift in the H2 1-0 S(1) (2.12 μm) line. The velocities are in km s−1 and in the local standard rest velocity and corrected by the velocity of the cloud (![]() km s−1, He et al. 2012). The yellow stars represent the point sources reported in Sect. 3.1, and the contours are the H2 knots (same as Fig. 3). Top panel: KMOS observations. The white regions were not covered by the observations. The dashed cyan rectangle defines the SINFONI field of view. Bottom panel: SINFONI observations.
km s−1, He et al. 2012). The yellow stars represent the point sources reported in Sect. 3.1, and the contours are the H2 knots (same as Fig. 3). Top panel: KMOS observations. The white regions were not covered by the observations. The dashed cyan rectangle defines the SINFONI field of view. Bottom panel: SINFONI observations.
Current usage metrics show cumulative count of Article Views (full-text article views including HTML views, PDF and ePub downloads, according to the available data) and Abstracts Views on Vision4Press platform.
Data correspond to usage on the plateform after 2015. The current usage metrics is available 48-96 hours after online publication and is updated daily on week days.
Initial download of the metrics may take a while.