Fig. 3
Download original image
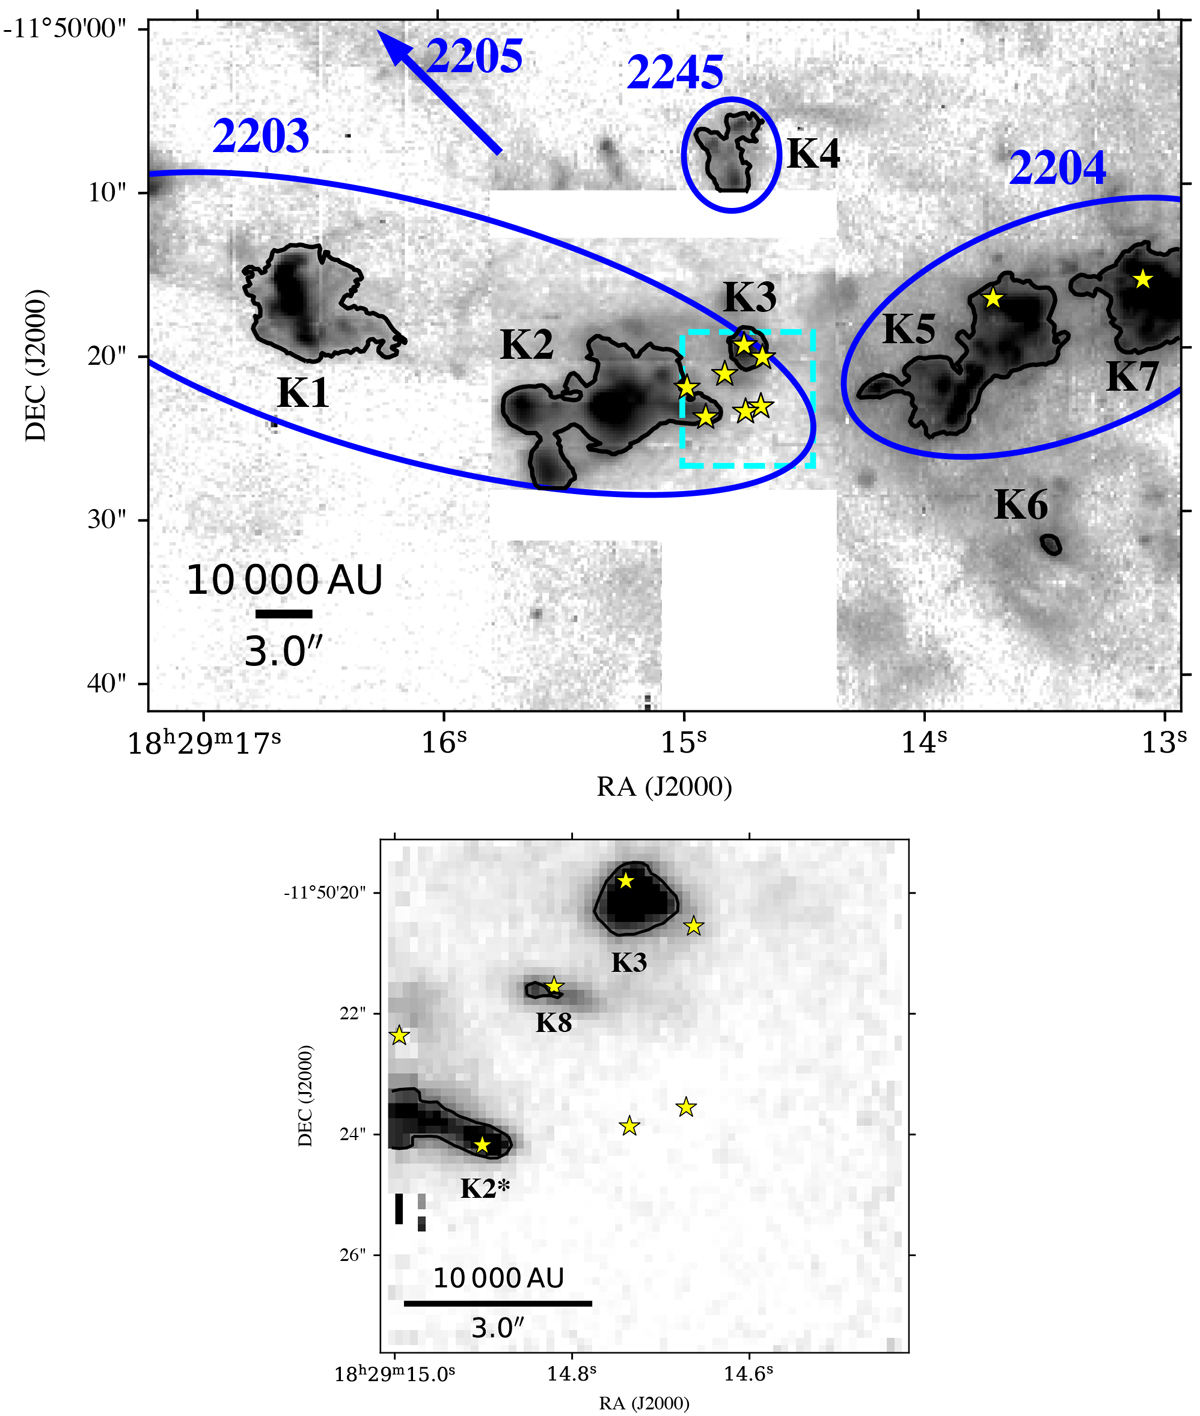
H2 1-0 S(1) (2.12 μm) continuum-subtracted emission, with jet knots outlined according to a 3σ threshold of the local background. The yellow stars represent the point sources reported in Sect. 3.1. Top panel: KMOS observations. The ellipses correspond to the molecular hydrogen objects (MHOs) in the IRAS 18264-1152 region; the white rectangles were not covered by the observations; the dashed cyan rectangle defines the SINFONI field of view. Bottom panel: SINFONI observations.
Current usage metrics show cumulative count of Article Views (full-text article views including HTML views, PDF and ePub downloads, according to the available data) and Abstracts Views on Vision4Press platform.
Data correspond to usage on the plateform after 2015. The current usage metrics is available 48-96 hours after online publication and is updated daily on week days.
Initial download of the metrics may take a while.