Fig. 2
Download original image
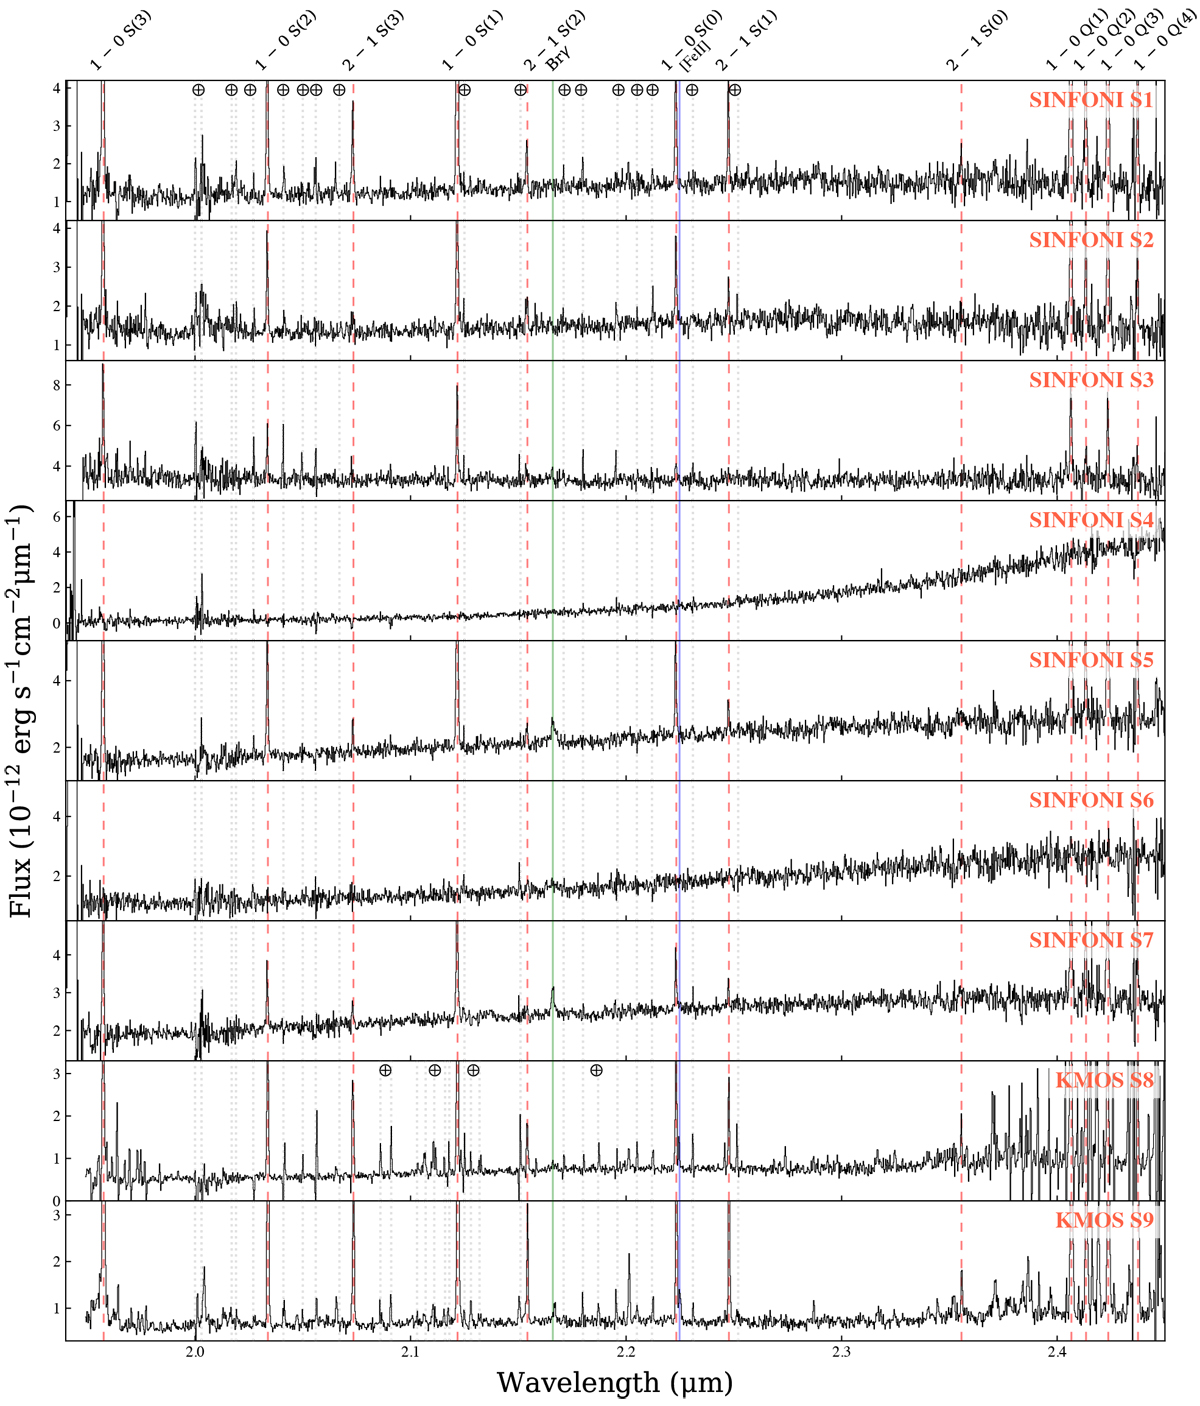
K-band spectra of point sources in SINFONI (S1–S7) and KMOS (S8–S9). Strong lines are cut off by the figure limits to allow for the identification of weaker features. The dashed red lines reveal the H2 transitions, the full green line identifies the Brγ transition, the full blueline identifies the [Fe II] transition. The Earth symbols and dotted grey lines label the residual atmospheric features (i.e.OH lines).
Current usage metrics show cumulative count of Article Views (full-text article views including HTML views, PDF and ePub downloads, according to the available data) and Abstracts Views on Vision4Press platform.
Data correspond to usage on the plateform after 2015. The current usage metrics is available 48-96 hours after online publication and is updated daily on week days.
Initial download of the metrics may take a while.