Fig. A.1
Download original image
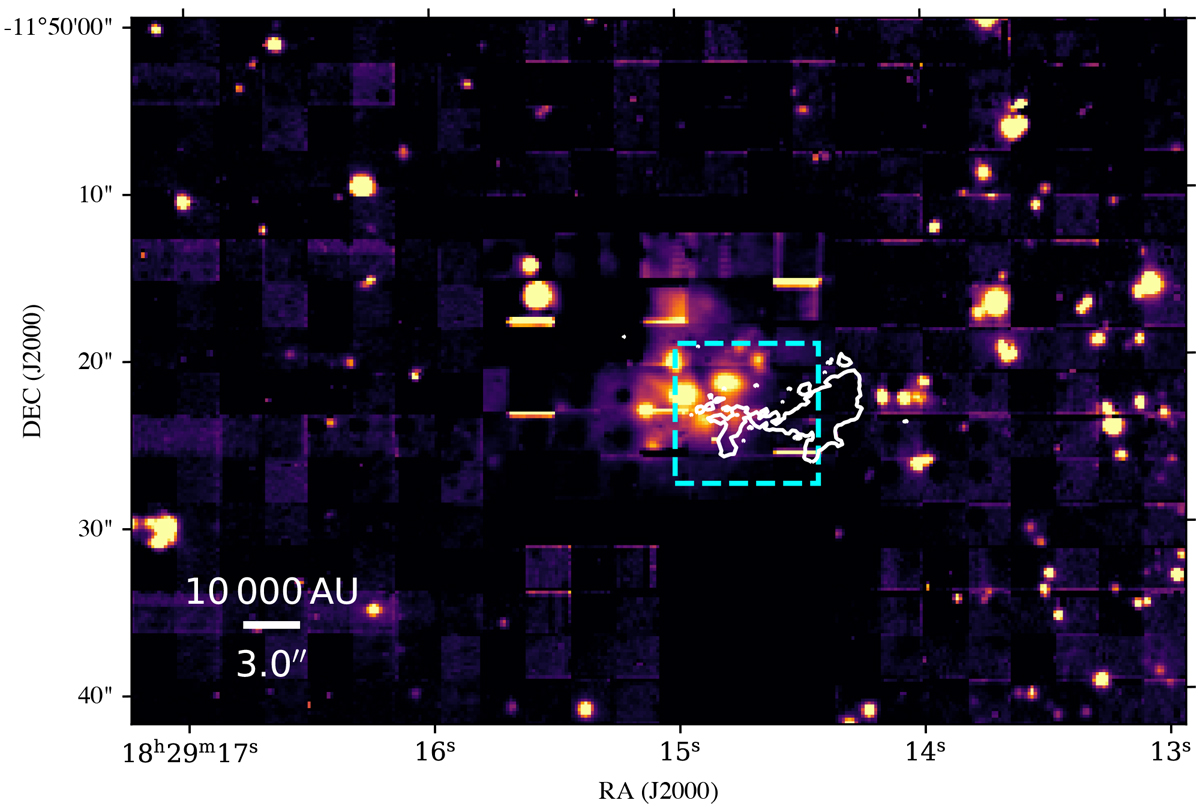
KMOS K-band continuum image (313 line-free channels across the entire K-band). The horizontal lines seen are due to poor data reduction, as they coincide with the edges of the individual fields of view of the IFUs. The dashed cyan rectangle defines the SINFONI field of view; the white contours are the ALMA 2.7 mm data analysed in Issac et al. (2020) (see text for more detail).
Current usage metrics show cumulative count of Article Views (full-text article views including HTML views, PDF and ePub downloads, according to the available data) and Abstracts Views on Vision4Press platform.
Data correspond to usage on the plateform after 2015. The current usage metrics is available 48-96 hours after online publication and is updated daily on week days.
Initial download of the metrics may take a while.