Fig. 11
Download original image
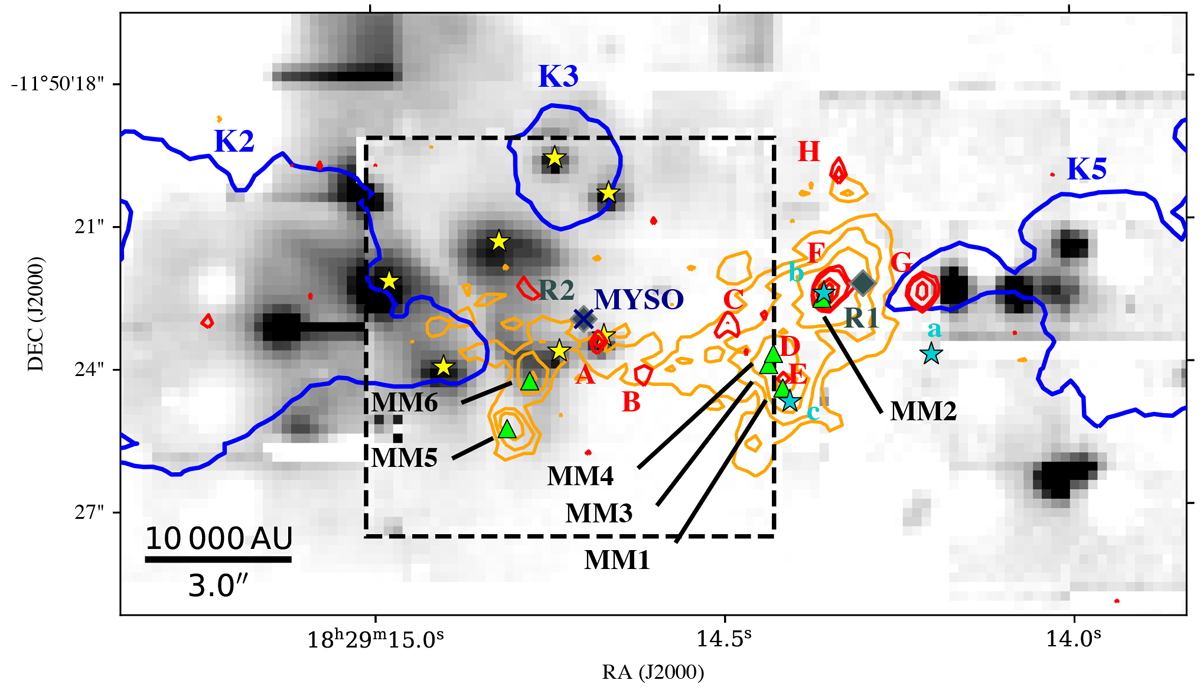
KMOS and SINFONI continuum emission image (SINFONI is within the dashed square, and KMOS is outside), overplotted with KMOS H2 knot contours (blue, same as Fig. 3) and data from literature. Legend: red contours (A–H) are VLA 6 cm data (Rosero et al. 2016, 2019); orange contours are ALMA 2.7 mm continuum, with green triangles (MM1 − MM6) being the millimetre cores identified (Issac et al. 2020), and the grey diamonds (R1 and R2) being uGMRT 1391.6 MHz ionised thermal jets from the same paper; cyan stars (a, b, and c) are VLA 1.3 cm and 7 mm (Zapata et al. 2006); dark blue cross is the location of the MYSO according to Cyganowski et al. (2008); yellow stars are the point sources identified in this work (see Sect. 4 for further details).
Current usage metrics show cumulative count of Article Views (full-text article views including HTML views, PDF and ePub downloads, according to the available data) and Abstracts Views on Vision4Press platform.
Data correspond to usage on the plateform after 2015. The current usage metrics is available 48-96 hours after online publication and is updated daily on week days.
Initial download of the metrics may take a while.