Fig. 1
Download original image
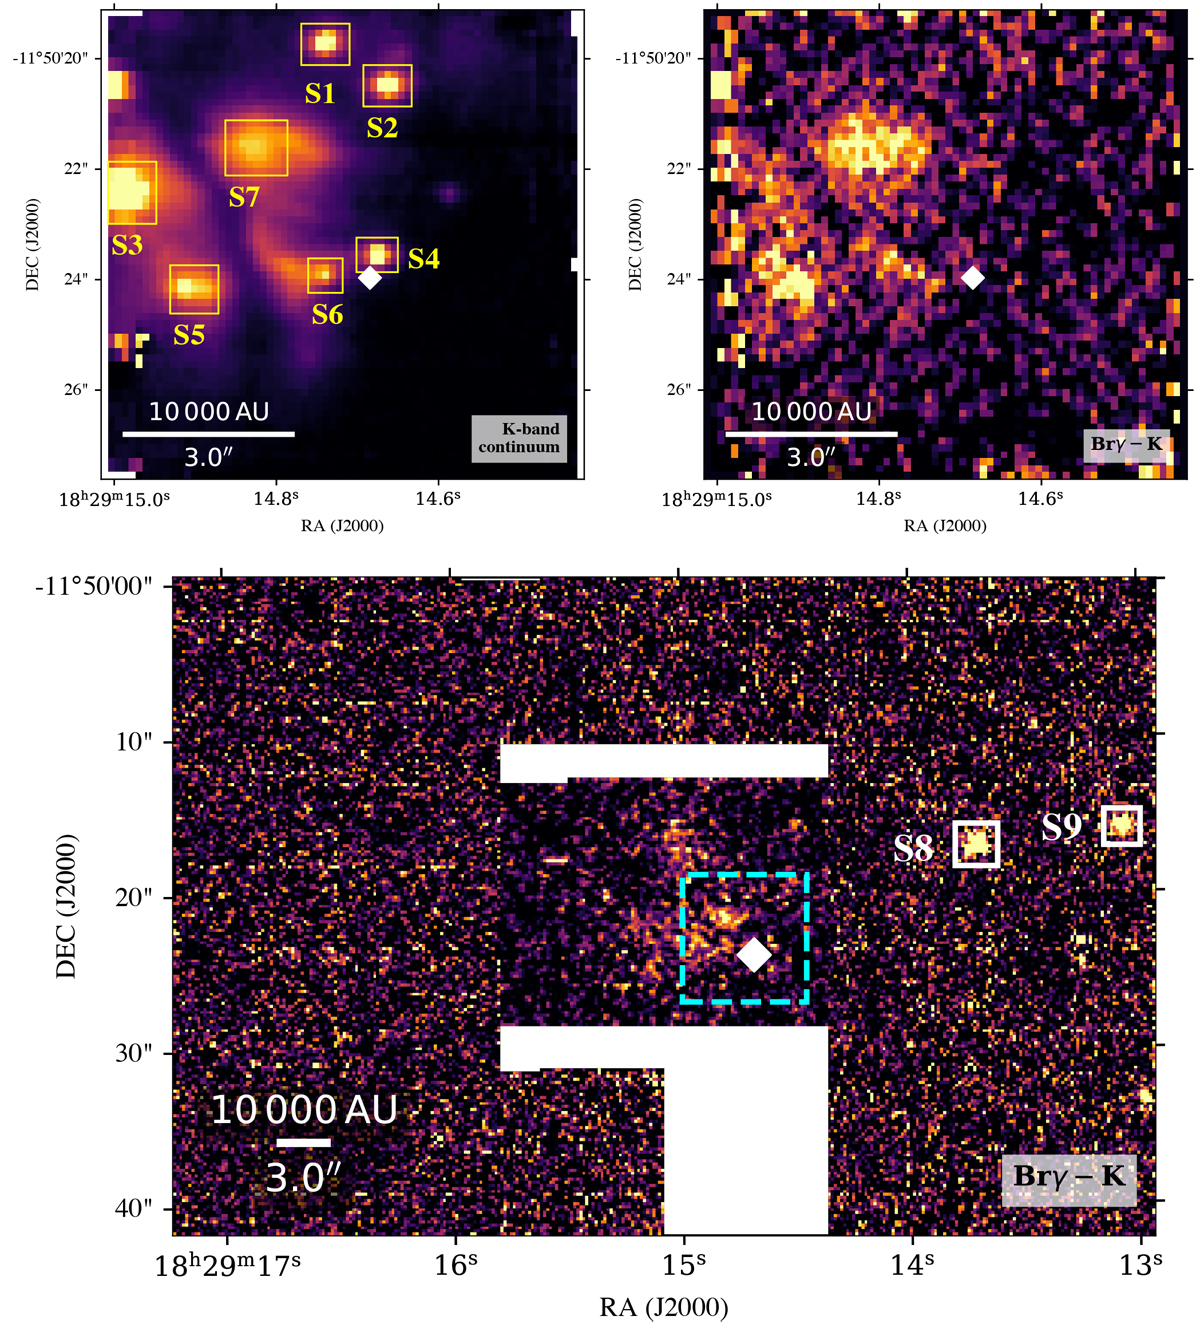
Top left: SINFONI K-band continuum emission. We identify seven point sources for which spectra are shown in Fig. 2. Top right: continuum-subtracted Brγ emission map in the SINFONI FoV. Bottom: continuum-subtracted Brγ emission map in the KMOS FoV, where two bright sources are identified. The white regions were not covered by the observations. The cyan dashed square represents the SINFONI FoV. The white diamond indicates the position of the IRAS 18264-1152 source (RA(J2000) = 18:29:14.6846, Dec(J2000) = −11:50:23.966, taken from SIMBAD).
Current usage metrics show cumulative count of Article Views (full-text article views including HTML views, PDF and ePub downloads, according to the available data) and Abstracts Views on Vision4Press platform.
Data correspond to usage on the plateform after 2015. The current usage metrics is available 48-96 hours after online publication and is updated daily on week days.
Initial download of the metrics may take a while.