Fig. 4.
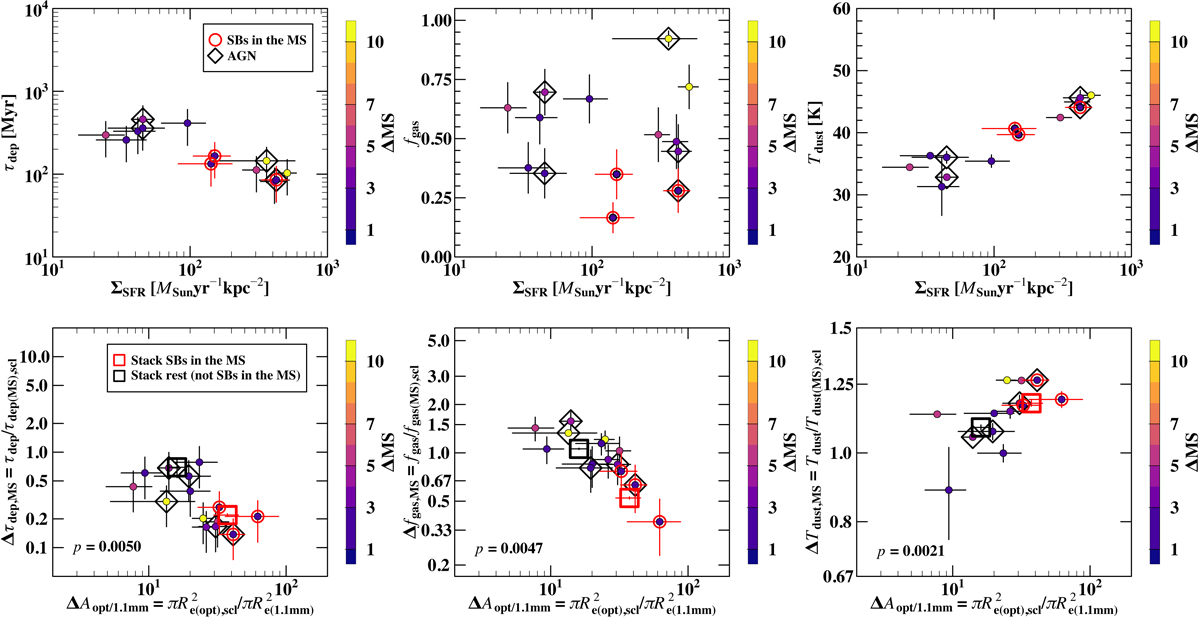
Download original image
Top row: τdep (first column), fgas (second column), and Tdust (third column) as a function of ΣSFR. Only galaxies with a Herschel counterpart with the most reliable size measurements in Gómez-Guijarro et al. (2022) are shown (corresponding to a detection S/Npeak ≥ 6.5). SBs in the MS are in red. Galaxies identified as AGN are highlighted with diamonds. All galaxies are color coded according to their ΔMS. Bottom row: deviations of τdep (first column), fgas (second column), and Tdust (third column) compared to the gas scaling relations of normal MS SFGs (ΔMS = 1) in relation with the deviations of the dust continuum areas compared to the structural scaling relation of normal SFGs at a fixed stellar mass and redshift. The gas scaling relations for τdep(z, M*, ΔMS) and fgas(z, M*, ΔMS) are from Tacconi et al. (2018), and for Tdust(z, ΔMS) from Schreiber et al. (2018), where ΔMS = 1. In the case of the structural scaling relation, we compared the dust continuum areas with the typical areas of star-forming stellar disks measured at optical wavelengths for late-type galaxies from van der Wel et al. (2014), at a fixed stellar mass and redshift. The stack of the 23/69 galaxies that were classified as SBs in the MS originally in Fig. 3 is shown as an empty red square (where the total number of galaxies accounts only for galaxies with a Herschel counterpart). Similarly, the stack of the remaining galaxies that were not labeled as SBs in the MS in Fig. 3 are shown as an empty black square.
Current usage metrics show cumulative count of Article Views (full-text article views including HTML views, PDF and ePub downloads, according to the available data) and Abstracts Views on Vision4Press platform.
Data correspond to usage on the plateform after 2015. The current usage metrics is available 48-96 hours after online publication and is updated daily on week days.
Initial download of the metrics may take a while.