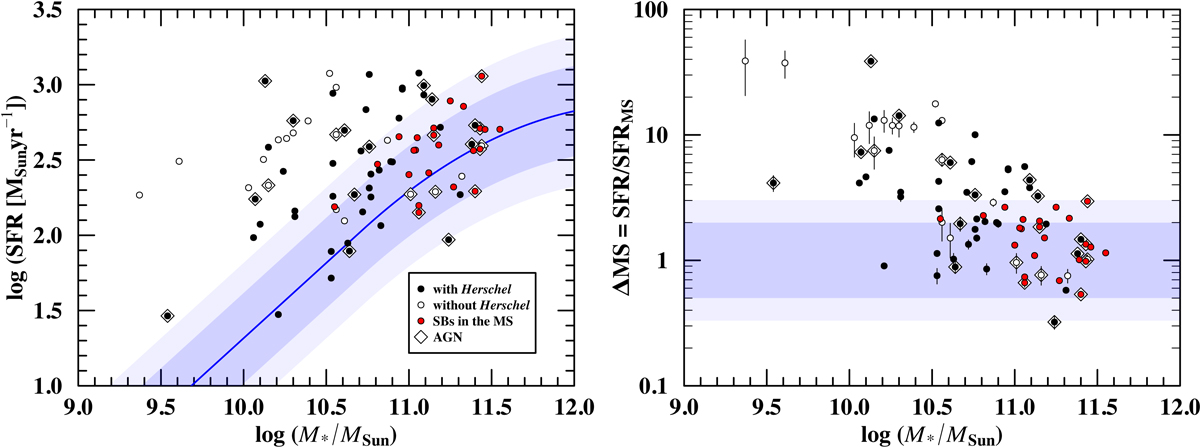
Fig. 2.
Download original image
Left panel: SFR–M* plane with the MS from Schreiber et al. (2015) displayed as a solid blue line. Its 1σ scatter associated with 0.5 < ΔMS < 2 (∼0.3 dex) is represented as a shaded blue area, with a more extended typical scatter of 0.33 < ΔMS < 3 (∼0.5 dex) in lighter blue. We note that the values are scaled to a common redshift (zmed = 2.46) as explained in the main text. Right panel: distance to the MS defined as the ratio of the SFR to the SFR of the MS at a fixed stellar mass and redshift (ΔMS = SFR/SFRMS). Filled circles represent galaxies with a Herschel counterpart and open circles galaxies without a Herschel counterpart. SBs in the MS are highlighted in red: galaxies with τdep below the scatter of the scaling relation and in the MS within a factor 3 (see Sect. 4). Galaxies identified as AGN are highlighted with diamonds.
Current usage metrics show cumulative count of Article Views (full-text article views including HTML views, PDF and ePub downloads, according to the available data) and Abstracts Views on Vision4Press platform.
Data correspond to usage on the plateform after 2015. The current usage metrics is available 48-96 hours after online publication and is updated daily on week days.
Initial download of the metrics may take a while.