Fig. 6
Download original image
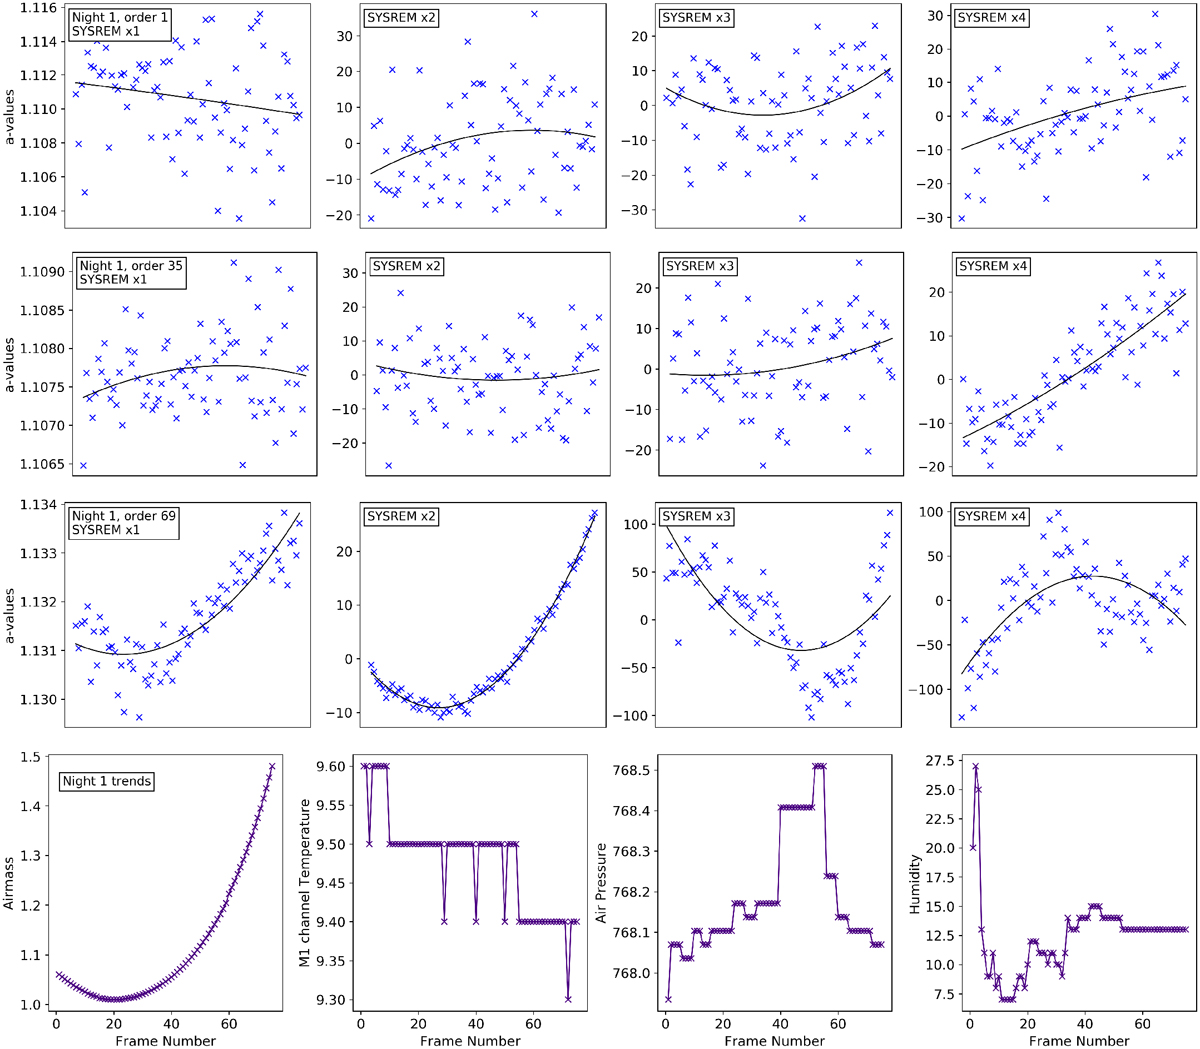
Sets of SYSREM a-values from Night 1of data that has been masked with a 1.4σ clip (blue crosses, top three rows, see Sect. 4.4), 2nd degree polynomials fitted to detect any trends (black lines, top three rows), and possible causes of the observed SYSREM trends (purple crosses, bottom row). Top three rows: a-values subtracted during the first, second, third and fourth iteration of SYSREM for orders 1, 35 and 69, respectively. There is a large variety in the shape of the trend removed during each iteration, and little similarity between the trends, indicating a strong wavelength dependence. Bottom row: air mass, primary mirror channel temperature, local air pressure and humidity during Night 1 of observations. The air mass values tightly correlate with the a-values for order 69 where tellurics were strongest. The other physical trends do not correlate with any of the sets of a-values.
Current usage metrics show cumulative count of Article Views (full-text article views including HTML views, PDF and ePub downloads, according to the available data) and Abstracts Views on Vision4Press platform.
Data correspond to usage on the plateform after 2015. The current usage metrics is available 48-96 hours after online publication and is updated daily on week days.
Initial download of the metrics may take a while.