Fig. 3
Download original image
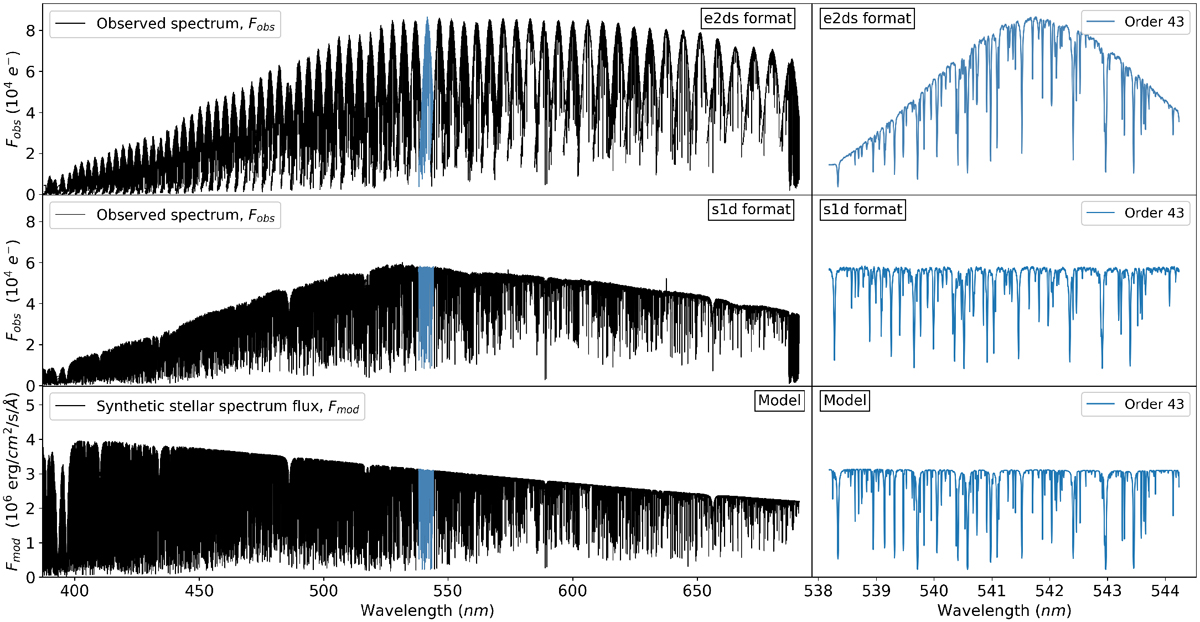
Extracted spectra (Fobs) in both e2ds (top panel) and s1d (middle panel) formats, and the synthetic stellar spectrum (Fmod, bottom panel) used in the cross-correlation. The units e− are photoelectrons. A zoom around wavelengths 538.2–533.2 nm (order 43) is shown in blue and the right-hand panels. These plots show the dense forest of spectral lines in our dataset. The continuum variation in the e2ds format is the uncorrected blaze function, while in the s1d format we see the residual low order instrument response in our non-flux calibrated data.
Current usage metrics show cumulative count of Article Views (full-text article views including HTML views, PDF and ePub downloads, according to the available data) and Abstracts Views on Vision4Press platform.
Data correspond to usage on the plateform after 2015. The current usage metrics is available 48-96 hours after online publication and is updated daily on week days.
Initial download of the metrics may take a while.