Fig. 2
Download original image
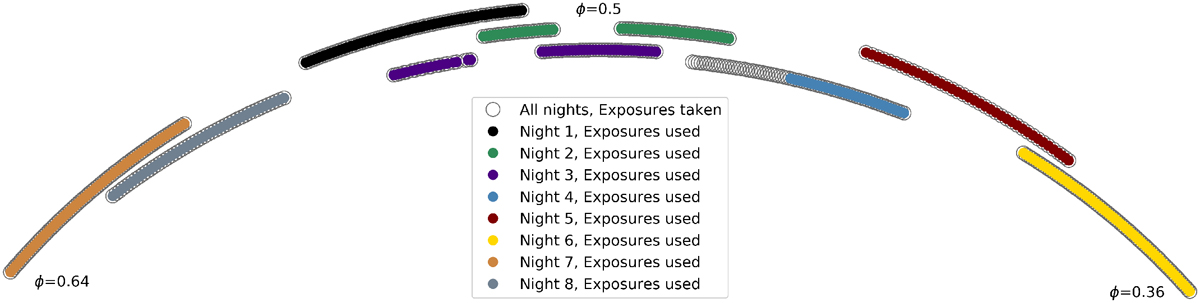
Phases, ϕ, covered during the eight nights. The open grey circles show all observations and the solid coloured circles show the frames used in the final analysis (see Table 1) from each night. Discarding unusable data from Night 4 left a gap in the phase coverage. The smallest phase observed (ϕ = 0.36), the largest phase observed (ϕ = 0.64), and the point of inferior conjunction (ϕ = 0.5), are marked.
Current usage metrics show cumulative count of Article Views (full-text article views including HTML views, PDF and ePub downloads, according to the available data) and Abstracts Views on Vision4Press platform.
Data correspond to usage on the plateform after 2015. The current usage metrics is available 48-96 hours after online publication and is updated daily on week days.
Initial download of the metrics may take a while.