Fig. 18
Download original image
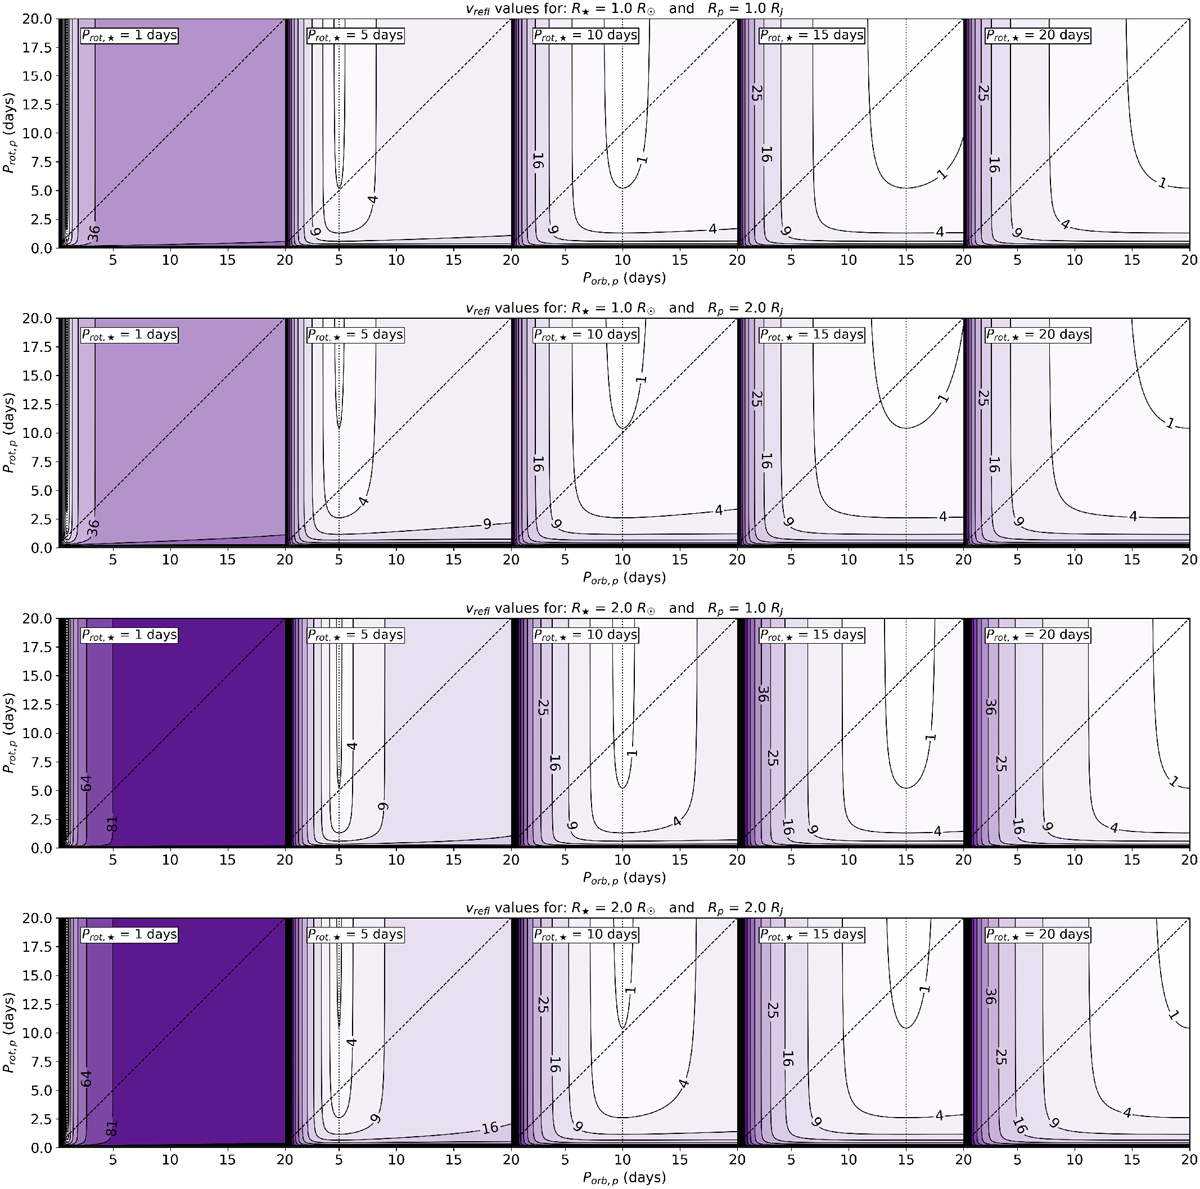
vrefl values, in kms−1 calculated using the equations defined in Rodler et al. (2010, see Eqs. (5), (4) and (6)), for a range of exoplanet and stellar parameters. Each row of plots shows vrefl values for different values of stellar radii (R⋆) and exoplanet radii (Rp). The y-axes correspond to the period of the exoplanet’s rotation on its own axis (Prot,p). The x-axes correspond to the period of the exoplanet’s orbit around its host star and extends down to Porb = 0.1 days). The dashed black diagonal lines show where Prot,p = Porb, i.e. the exoplanet is always showing the same face to its host star (as is the case for 51 Pegasi b). Each individual plot corresponds to a different period of the star’s rotation on its own axis (Prot,⋆). The dotted black vertical lines show where Prot,⋆ = Porb, i.e. the star is always showing the same face to the exoplanet. The point where the dashed and dotted black lines cross mark where Prot,p = Prot,⋆ = Porb, i.e. the star-exoplanet system is in a full tidal lock.
Current usage metrics show cumulative count of Article Views (full-text article views including HTML views, PDF and ePub downloads, according to the available data) and Abstracts Views on Vision4Press platform.
Data correspond to usage on the plateform after 2015. The current usage metrics is available 48-96 hours after online publication and is updated daily on week days.
Initial download of the metrics may take a while.