Fig. 17
Download original image
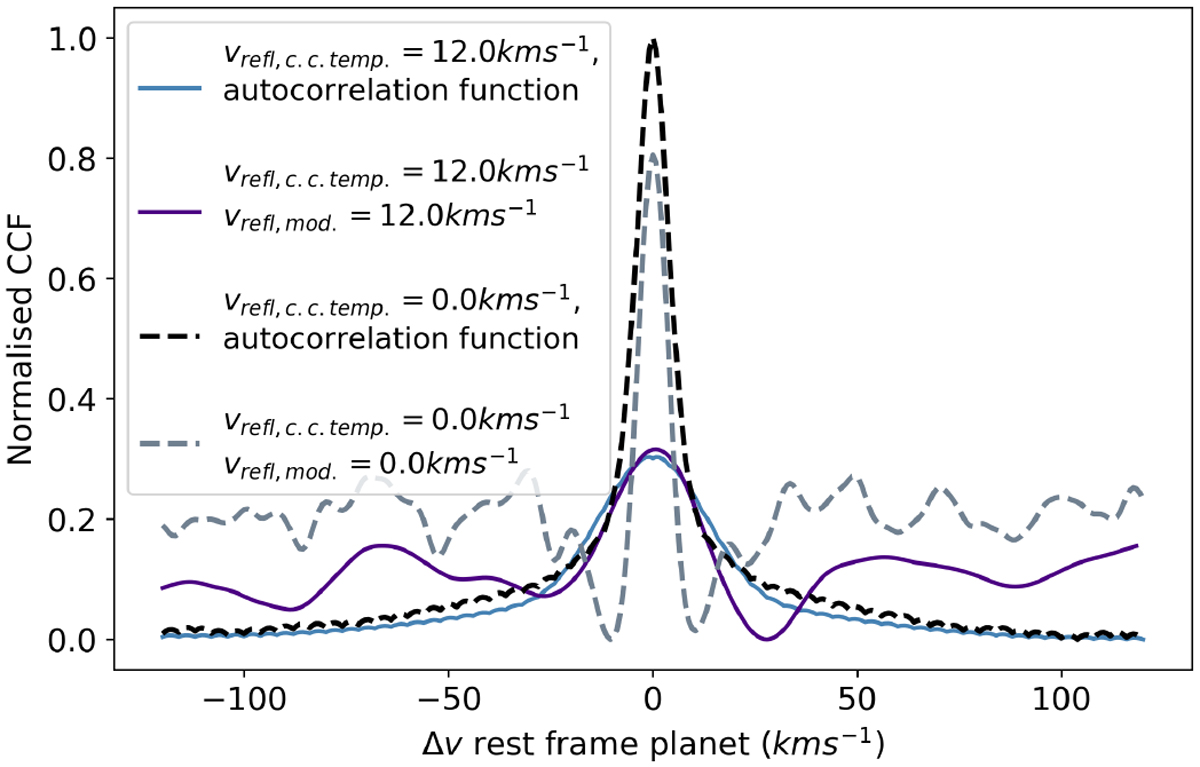
Comparison of the autocorrelation function of the model, with (solid) and without (dashed) broadening, to the CCFs obtained after injecting models into the observed data (purple and grey lines), to assess if post-processing affects the FWHM of the signal. All are normalised with respect to the black dashed line for visual purposes. In the autocorrelation functions, one spectrum has the residuals mask from Sect. 4.4 applied beforehand to better match the steps in the analysis that exclude the more saturated stellar features. The FWHM values of the autocorrelation functions are 34.4 km s−1 and 10.4 km s−1, respectively with (blue solid line) and without (black dashed line) broadening. For the injected models, the FWHM of the CCFs are 29.6 km s−1 (purple solidline), and 7.2 km s−1 (grey dashed line), respectively with and without broadening. The grey and purple lines correspond to their un-normalised counterparts in Fig. 9.
Current usage metrics show cumulative count of Article Views (full-text article views including HTML views, PDF and ePub downloads, according to the available data) and Abstracts Views on Vision4Press platform.
Data correspond to usage on the plateform after 2015. The current usage metrics is available 48-96 hours after online publication and is updated daily on week days.
Initial download of the metrics may take a while.