Fig. 13
Download original image
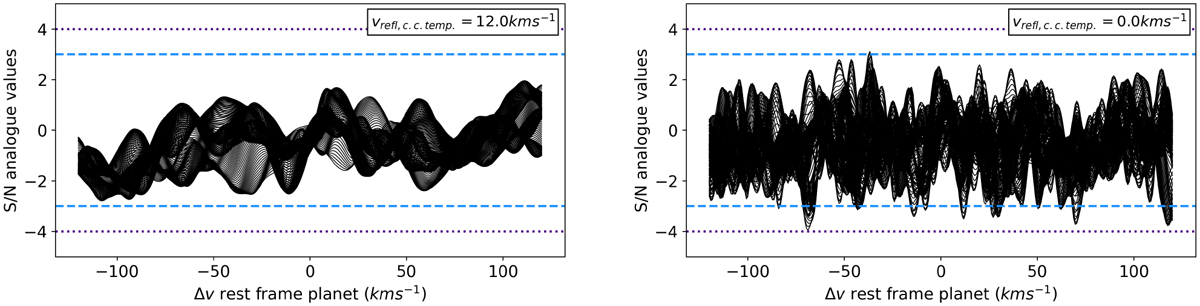
Summed 1D CCFs of the observed data in terms of S/N, where each lines corresponds to a different Kp in 40 ≤ Kp ≤ 200 km s−1, for cases 1 (left) and 3 (right), with cross-correlation templates with and without broadening (vrefl, c.c. temp = 12.0 km s−1 and 0.0 km s−1 respectively). The dashed light blue line and the dotted purple line mark the S∕N = ±3 and S∕N = ±4 thresholds. The cross-correlation template without rotational broadening results in stronger noise spikes due to matching with narrower lines in the residual host star spectrum.
Current usage metrics show cumulative count of Article Views (full-text article views including HTML views, PDF and ePub downloads, according to the available data) and Abstracts Views on Vision4Press platform.
Data correspond to usage on the plateform after 2015. The current usage metrics is available 48-96 hours after online publication and is updated daily on week days.
Initial download of the metrics may take a while.