Fig. 11
Download original image
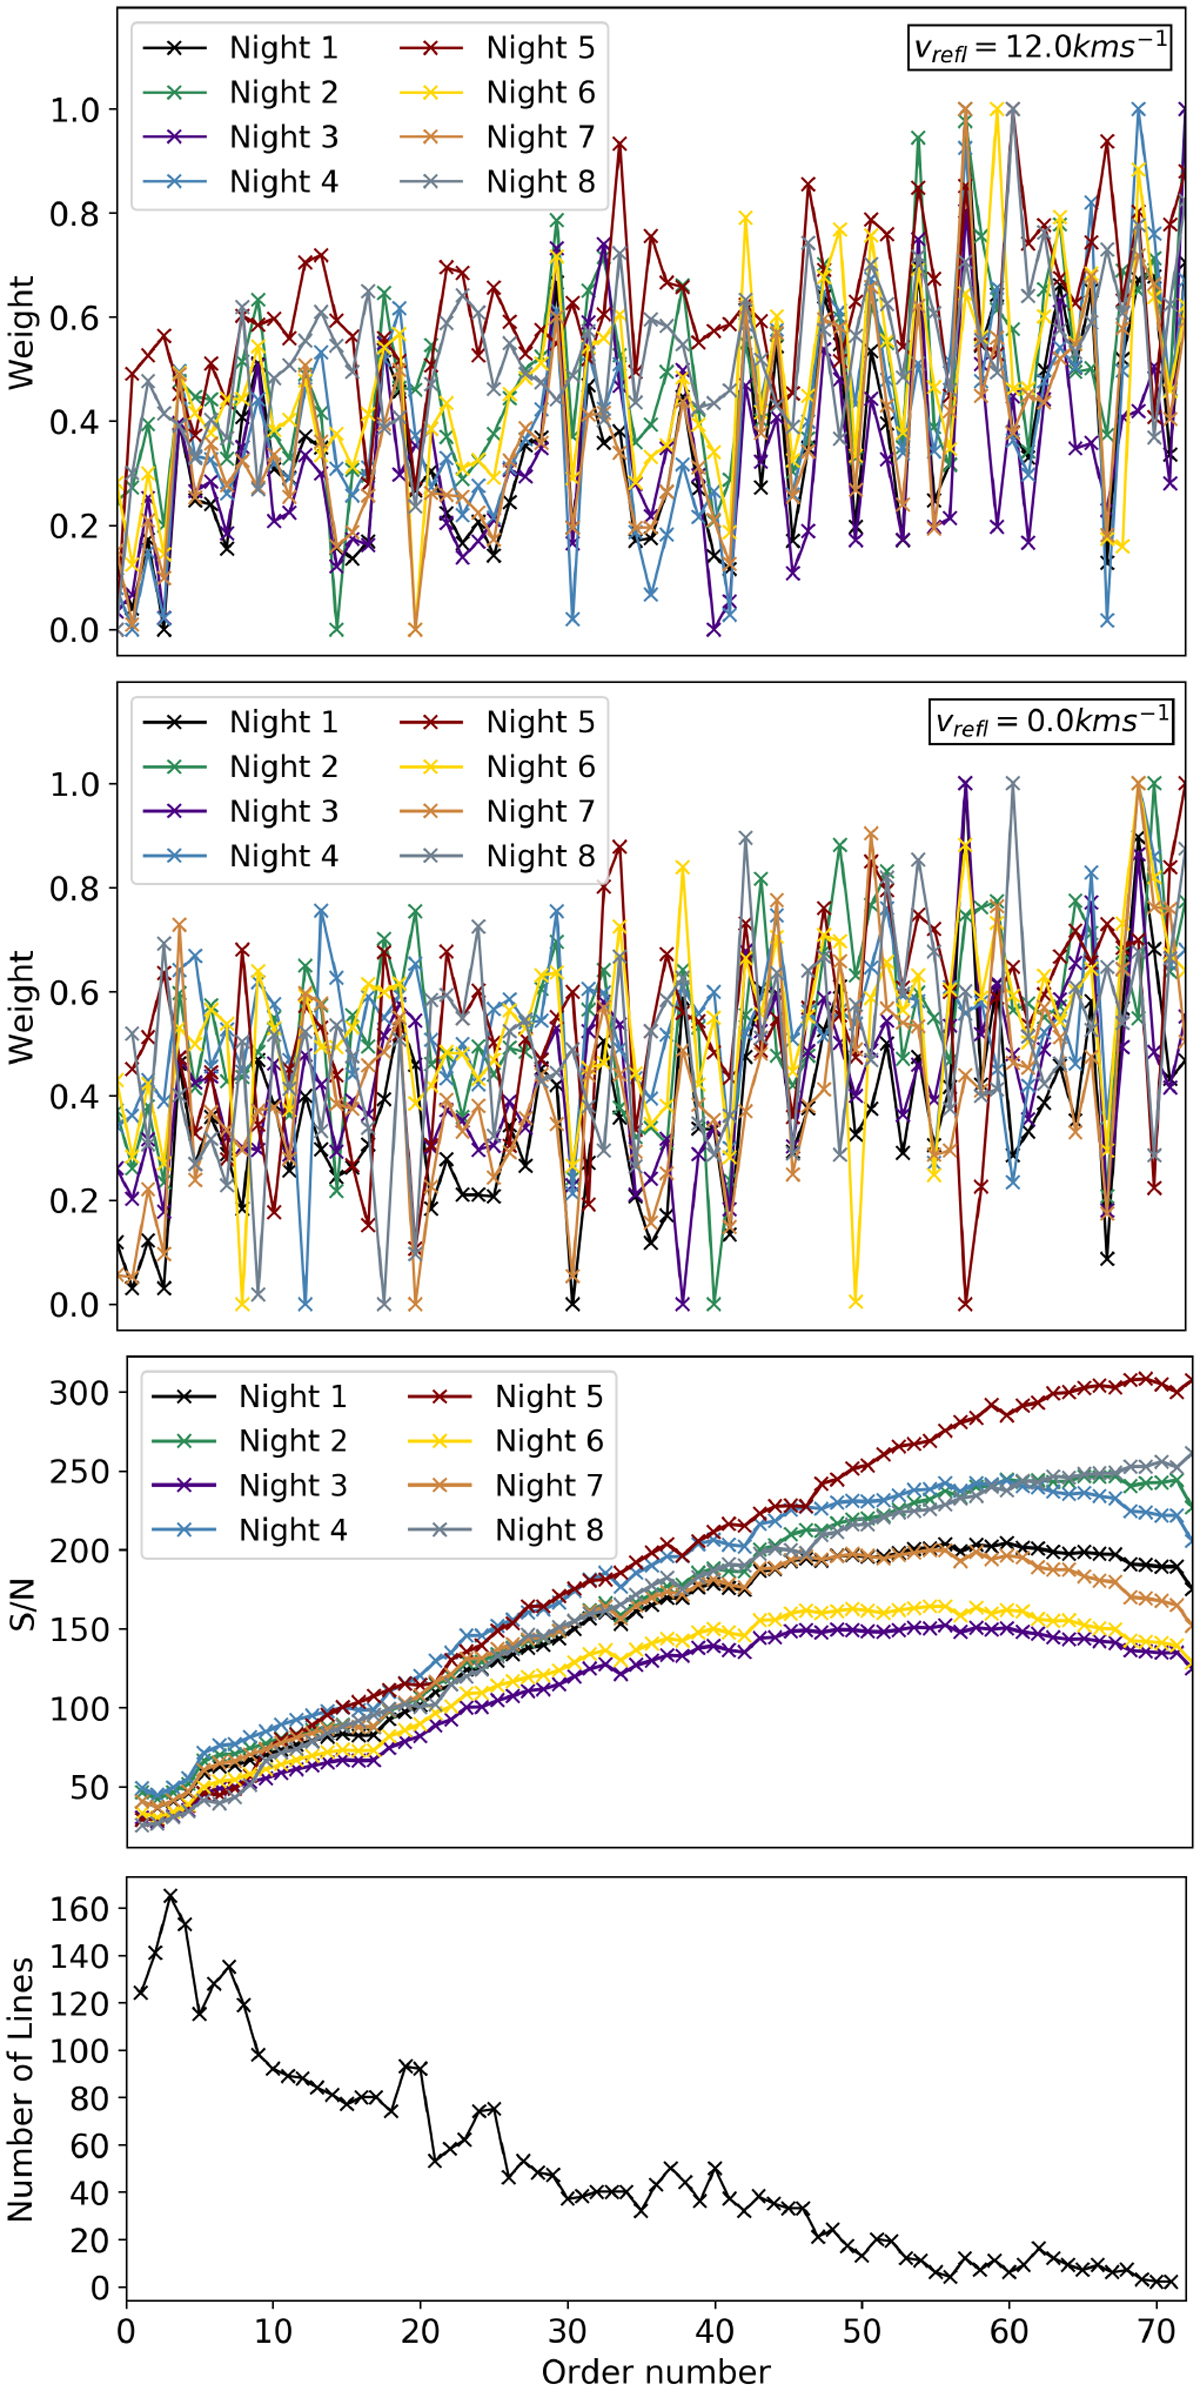
Top two panels: CCF weights for each night of data, for cases 1 and 2 (top panel) and for cases 3 and 4 (second panel). Third panel: S/N per order, for each night of data. The S/N increases towards the red showing the sensitivity of both HARPS detectors. Bottom panel: number of stellar lines per order, which is the same for each night of data.
Current usage metrics show cumulative count of Article Views (full-text article views including HTML views, PDF and ePub downloads, according to the available data) and Abstracts Views on Vision4Press platform.
Data correspond to usage on the plateform after 2015. The current usage metrics is available 48-96 hours after online publication and is updated daily on week days.
Initial download of the metrics may take a while.