Free Access
Fig. 9.
Download original image
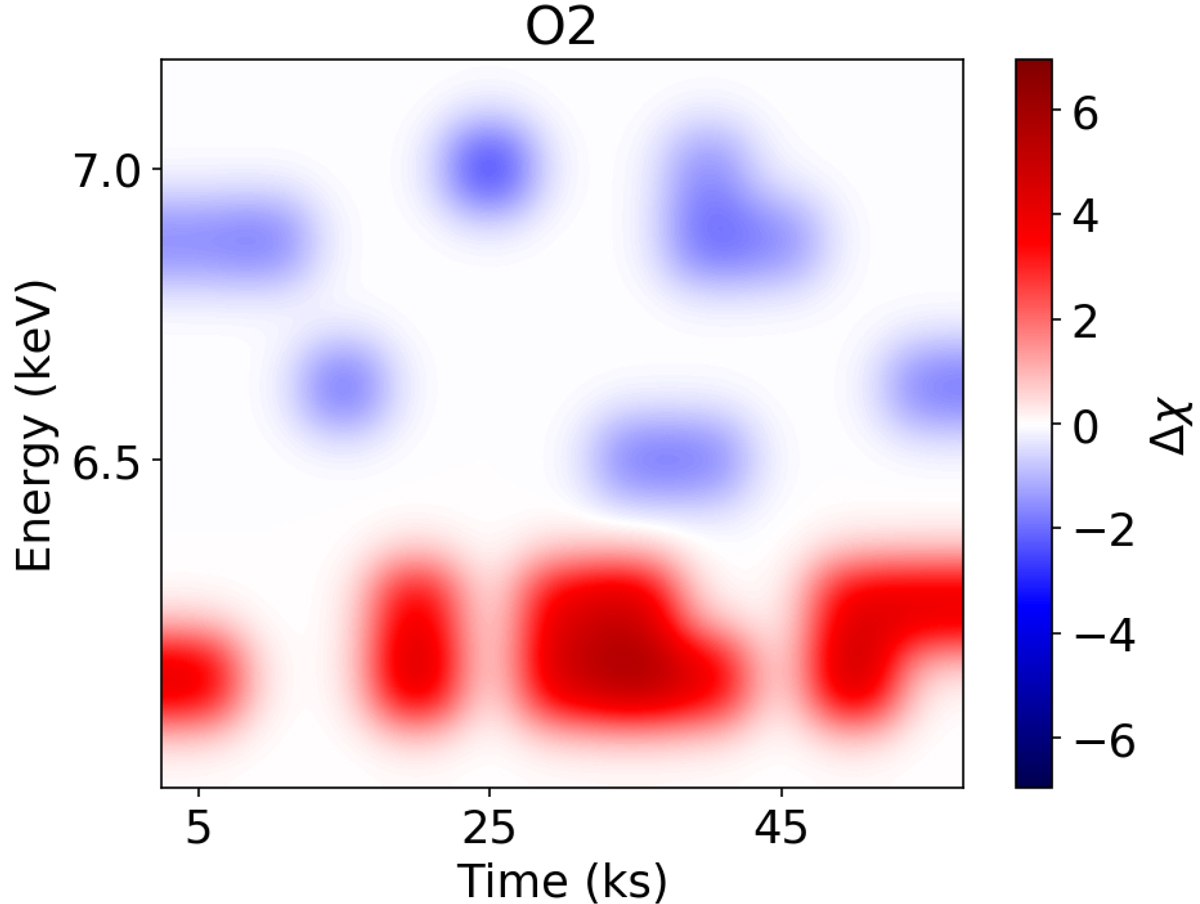
Residual map of O2 where we set a higher threshold in terms of Δχ to qualitatively highlight the possible link between the peaks of the Fe Kα emission line (in red) and the most intense absorption dips (in blue).
Current usage metrics show cumulative count of Article Views (full-text article views including HTML views, PDF and ePub downloads, according to the available data) and Abstracts Views on Vision4Press platform.
Data correspond to usage on the plateform after 2015. The current usage metrics is available 48-96 hours after online publication and is updated daily on week days.
Initial download of the metrics may take a while.