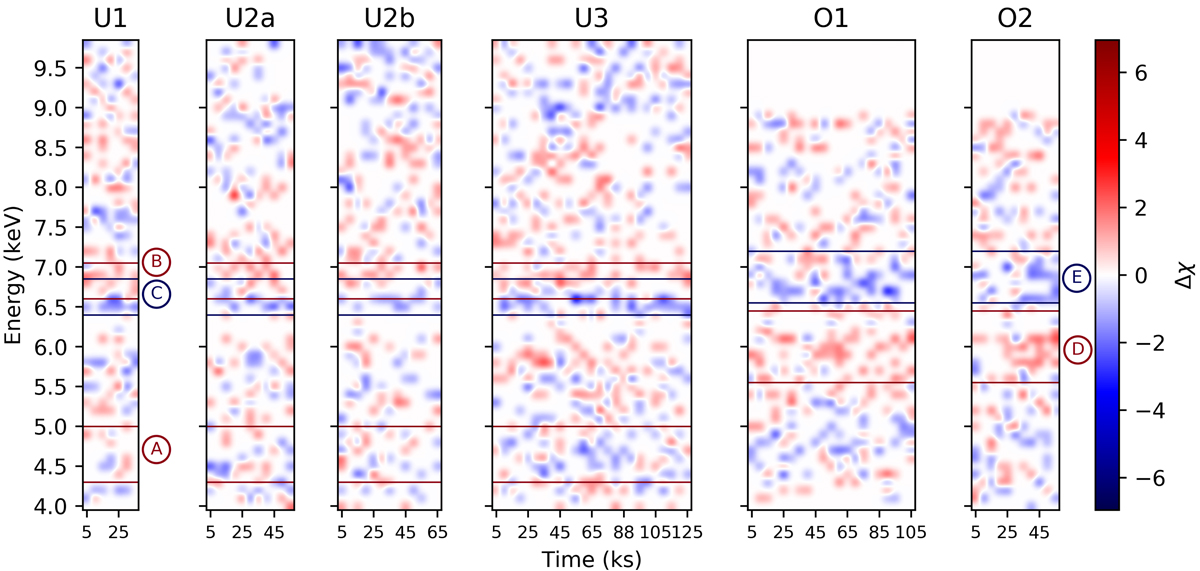
Fig. 6.
Download original image
Residual maps produced with the baseline model pcfabs × (power law + gauss). The time bin size is 5 ks, while the energy resolution is 0.1 keV. Each pixel shows the value of Δχ (i.e. residual/data error, shown in red for the positive and in blue for the negative residuals) to give an estimate of the significance, even though the RM are meant to be used here as a qualitative way to identify patterns rather than a tool to estimate the significance of each feature. A Gaussian interpolation is applied to the pixels to highlight the features and facilitate the identification of possible patterns. The area at E > 9 keV of both O1 and O2 are purposefully left blank as the threshold of 20 photons per pixel is not met because of the low flux (see Sect. 4). The horizontal lines highlight the energy bands of the most significant groups of features indicated in Fig. 5 and Table 2.
Current usage metrics show cumulative count of Article Views (full-text article views including HTML views, PDF and ePub downloads, according to the available data) and Abstracts Views on Vision4Press platform.
Data correspond to usage on the plateform after 2015. The current usage metrics is available 48-96 hours after online publication and is updated daily on week days.
Initial download of the metrics may take a while.