Fig. 5.
Download original image
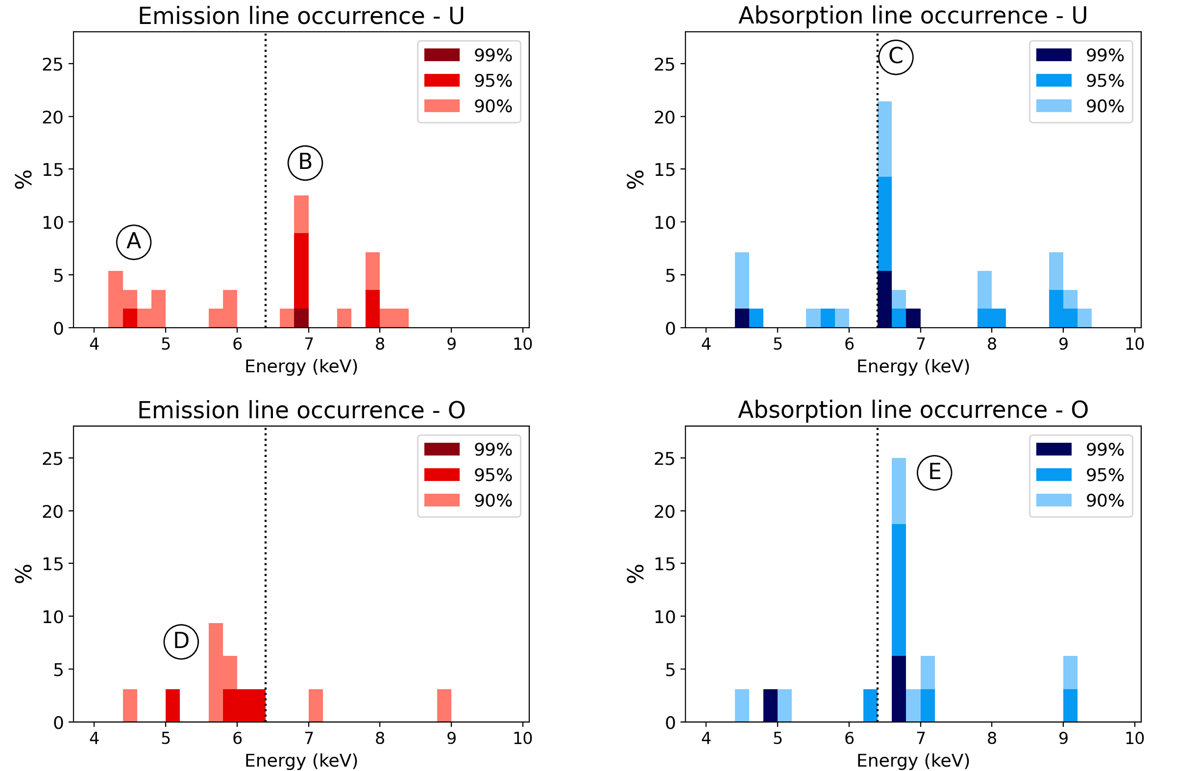
Distribution in energy (observed frame) of the features detected via blind search. The energy bins are 0.2 keV wide. Top panels: results of the unobscured dataset (U1, U2a, U2b, U3), while the bottom panels refer to the obscured datasets (O1, O2). Left panels: detections of emission lines are reported (red), while the right panels report detections of absorption lines (blue): in both cases, the darker the colour the higher the significance, i.e. the measured Δχ2. The percentage on the y axes is the ratio between the number of detections in each bin and the total number of spectra for the two sets of observations (56 in total for the unobscured, and 32 in total for the obscured). The dotted line reported in all four figures is the nominal energy of the Fe Kα and is shown purely as a visual reference. The letters A–E indicate the clusters of lines that globally reach a significance ≳3σ, as indicated in Table 2 and described in Sect. 3.4.
Current usage metrics show cumulative count of Article Views (full-text article views including HTML views, PDF and ePub downloads, according to the available data) and Abstracts Views on Vision4Press platform.
Data correspond to usage on the plateform after 2015. The current usage metrics is available 48-96 hours after online publication and is updated daily on week days.
Initial download of the metrics may take a while.