Fig. 9.
Download original image
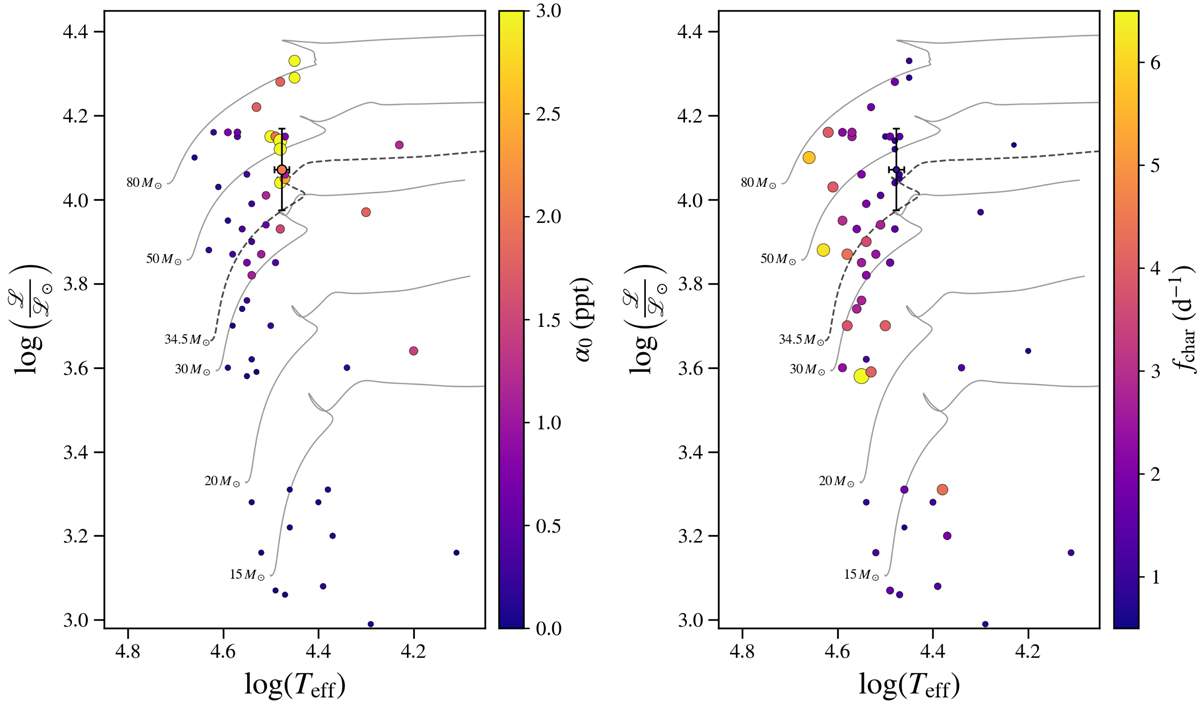
Spectroscopic HR diagrams showing the location of massive stars exhibiting low-frequency stochastic variability and analysed by Bowman et al. (2020). The spectroscopic luminosity is defined as ![]() , where Teff and g denote the effective temperature and surface gravity of a star, respectively. The circles with error bars mark the position of the ExtEEV using its physical properties estimated by Jaya21. The colour and size of a symbol reflects the value of α0 (left) and fchar (right). Solid lines show MIST [Fe/H] = 0, v/vcrit = 0 evolutionary tracks (Choi et al. 2016; Dotter 2016) starting at the zero-age main sequence (ZAMS). The dashed-line evolutionary track corresponds to the suspected mass of the ExtEEV, 34.5 M⊙, assuming a mean metallicity of stars in the LMC, [Fe/H] = − 0.4 and v/vcrit = 0.4.
, where Teff and g denote the effective temperature and surface gravity of a star, respectively. The circles with error bars mark the position of the ExtEEV using its physical properties estimated by Jaya21. The colour and size of a symbol reflects the value of α0 (left) and fchar (right). Solid lines show MIST [Fe/H] = 0, v/vcrit = 0 evolutionary tracks (Choi et al. 2016; Dotter 2016) starting at the zero-age main sequence (ZAMS). The dashed-line evolutionary track corresponds to the suspected mass of the ExtEEV, 34.5 M⊙, assuming a mean metallicity of stars in the LMC, [Fe/H] = − 0.4 and v/vcrit = 0.4.
Current usage metrics show cumulative count of Article Views (full-text article views including HTML views, PDF and ePub downloads, according to the available data) and Abstracts Views on Vision4Press platform.
Data correspond to usage on the plateform after 2015. The current usage metrics is available 48-96 hours after online publication and is updated daily on week days.
Initial download of the metrics may take a while.