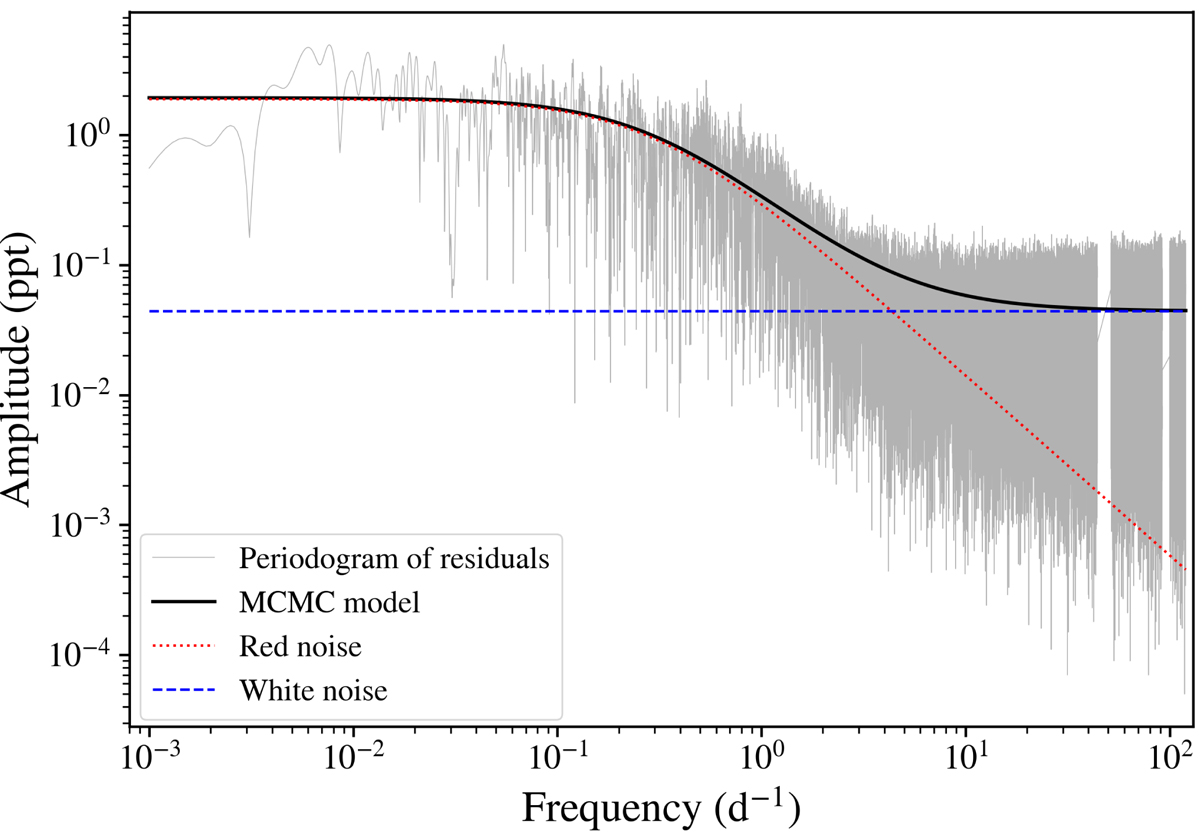
Fig. 8.
Download original image
Frequency spectrum of the residual TESS light curve after subtracting all significant coherent signals and rejecting data close to the periastron passages. The black solid line represents the best-fit model given by Eq. (1). The stochastic component of the model is denoted with a red dotted line while the horizontal blue dashed line corresponds to the white noise level. The two gaps in the data above 10 d−1 correspond to the location of aliases around the even multiples of the Nyquist frequency that we removed before the fit.
Current usage metrics show cumulative count of Article Views (full-text article views including HTML views, PDF and ePub downloads, according to the available data) and Abstracts Views on Vision4Press platform.
Data correspond to usage on the plateform after 2015. The current usage metrics is available 48-96 hours after online publication and is updated daily on week days.
Initial download of the metrics may take a while.