Free Access
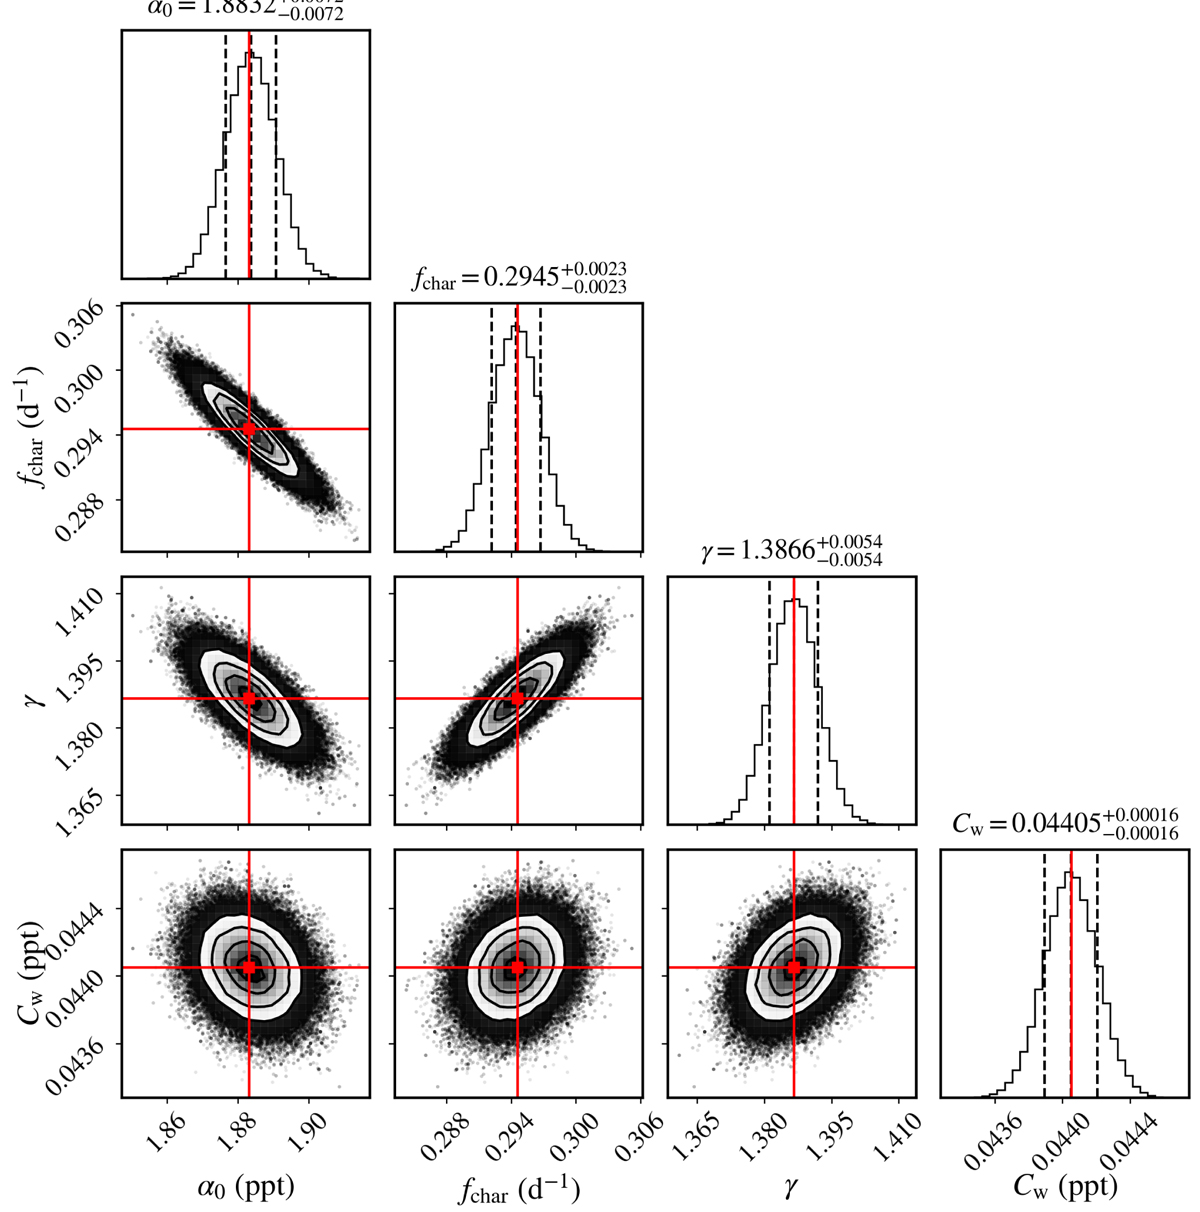
Fig. 7.
Download original image
Corner plot resulting from our MCMC analysis of the TESS residual light curve of the ExtEEV. Red markers indicate the best-fit solution. Three vertical dashed lines superimposed on each marginalised one-dimensional posterior distribution denote 16%, 50%, and 84% quantiles.
Current usage metrics show cumulative count of Article Views (full-text article views including HTML views, PDF and ePub downloads, according to the available data) and Abstracts Views on Vision4Press platform.
Data correspond to usage on the plateform after 2015. The current usage metrics is available 48-96 hours after online publication and is updated daily on week days.
Initial download of the metrics may take a while.