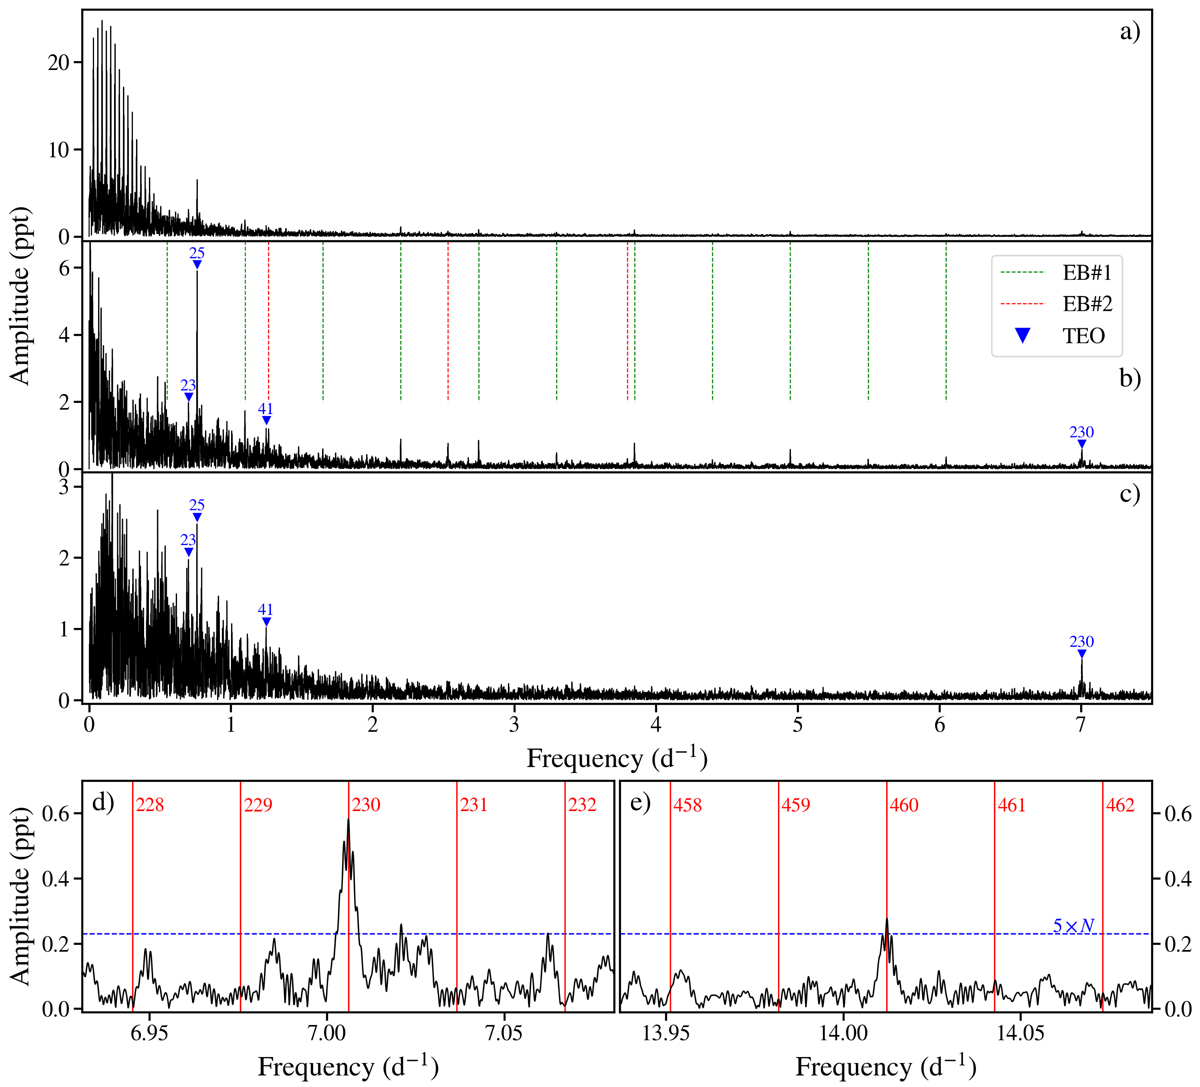
Fig. 4.
Download original image
Fourier frequency spectra of the TESS light curve of the ExtEEV. (a) Frequency spectrum of the original TESS light curve. (b) The same as in (a), but after subtracting the heartbeat signal contributing to the lowest (n = 1–17) orbital harmonics. Vertical dashed lines indicate frequencies present due to the contamination by the two nearby eclipsing binaries, EB#1 (green) and EB#2 (red, only odd harmonics). More details are provided in the main text. Blue triangles mark the position of the detected TEOs and are labelled with n. (c) The same as in (b), but after subtraction of the signal from EB#1, EB#2, and the dominant n = 25 TEO. A mild detrending at low frequencies was also applied. (d) and (e) Zoomed parts of the frequency spectrum shown in panel c, in the vicinity of n = 230 TEO (d) and its lowest harmonic (e). Red vertical lines denote the position of the consecutive orbital frequency harmonics labelled with n. The dashed horizontal line shows the detection level defined as five times the noise in the spectrum calculated in the range 10–40 d−1.
Current usage metrics show cumulative count of Article Views (full-text article views including HTML views, PDF and ePub downloads, according to the available data) and Abstracts Views on Vision4Press platform.
Data correspond to usage on the plateform after 2015. The current usage metrics is available 48-96 hours after online publication and is updated daily on week days.
Initial download of the metrics may take a while.