Fig. 2.
Download original image
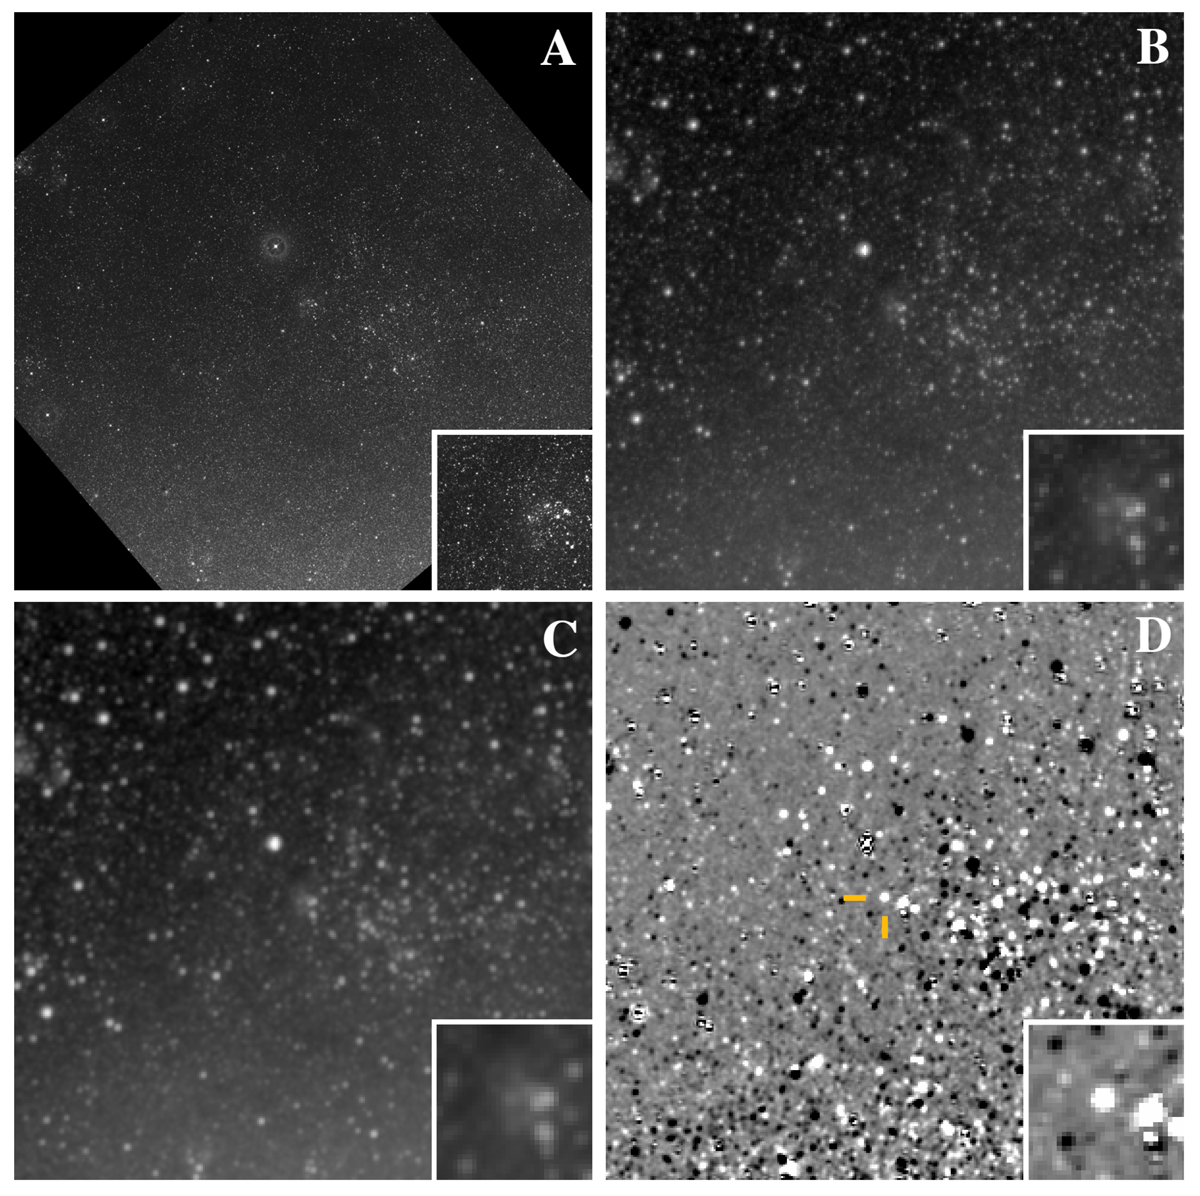
Summary of DIA analysis performed on TESS FFIs. Each panel is a 105 ′ × 105′ square centred on the position of the ExtEEV. The insets in the lower right corners show a zoomed view of the central areas, each 12 ′ × 12′. (A) DSS infrared image scaled and oriented as the TESS FFI cut-outs presented in panels B, C, and D. The image was generated using DSS. (B) A sample original 300 × 300 pix cut-out of TESS FFI from sector 7. (C) The same as in panel B, but convolved with a 2D Gaussian kernel having constant standard deviation of σ= 0.5 pix. (D) The difference image generated by pyDIA which corresponds to the image shown in panel C. The intersection of orange markers denotes the position of the ExtEEV. The images in panels B–D correspond to the epoch of maximum light of the ExtEEV.
Current usage metrics show cumulative count of Article Views (full-text article views including HTML views, PDF and ePub downloads, according to the available data) and Abstracts Views on Vision4Press platform.
Data correspond to usage on the plateform after 2015. The current usage metrics is available 48-96 hours after online publication and is updated daily on week days.
Initial download of the metrics may take a while.