Fig. 16.
Download original image
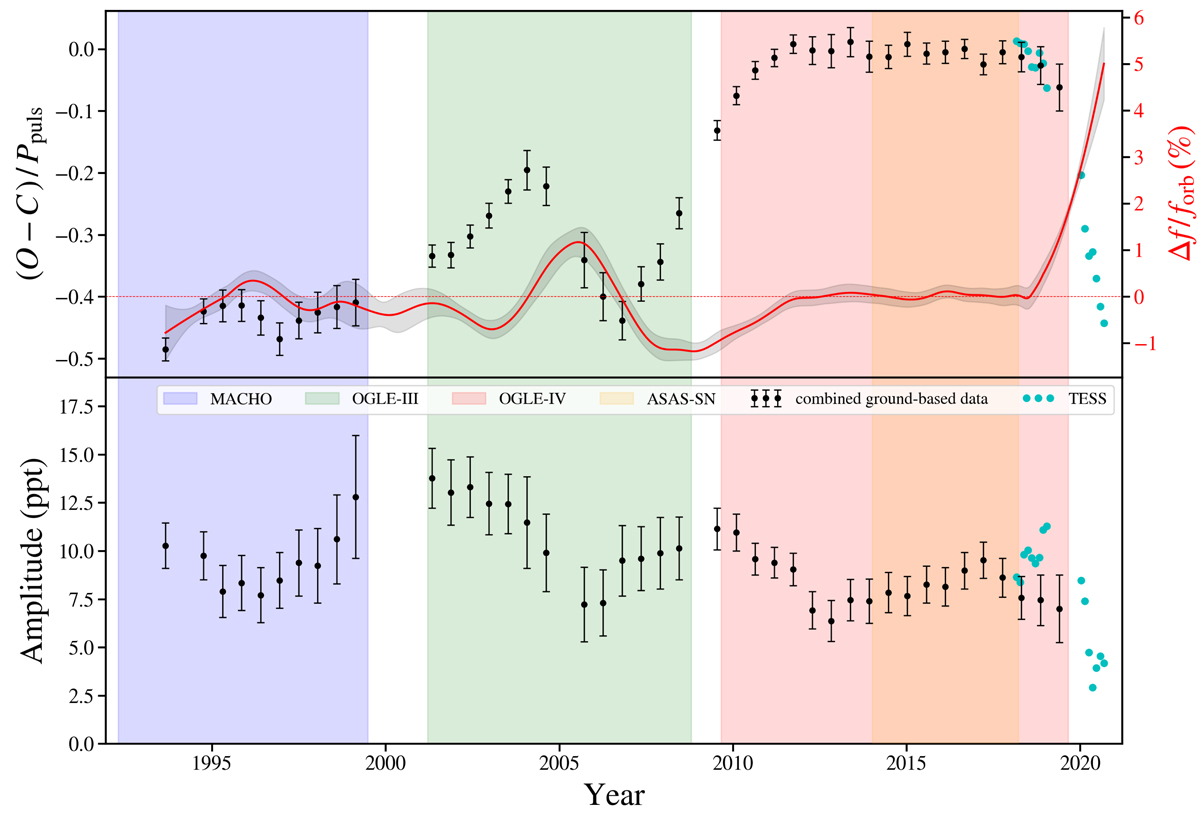
O − C diagram (top) and amplitude changes (bottom) of the n = 25 TEO observed in the combined ground-based data from the MACHO, OGLE-III, OGLE-IV, and ASAS-SN surveys and the TESS space mission. Vertical stripes mark the time span of the light curves from different ground-based surveys. The solid red curve in the upper panel shows the values of Δf defined by Eq. (3), expressed in terms of the orbital frequency (in per cent). The units of Δf/forb are shown as a right-hand ordinate. The grey shaded area around the curve represents the ±1σ confidence interval derived from the Monte Carlo simulations. More details are given in the main text.
Current usage metrics show cumulative count of Article Views (full-text article views including HTML views, PDF and ePub downloads, according to the available data) and Abstracts Views on Vision4Press platform.
Data correspond to usage on the plateform after 2015. The current usage metrics is available 48-96 hours after online publication and is updated daily on week days.
Initial download of the metrics may take a while.