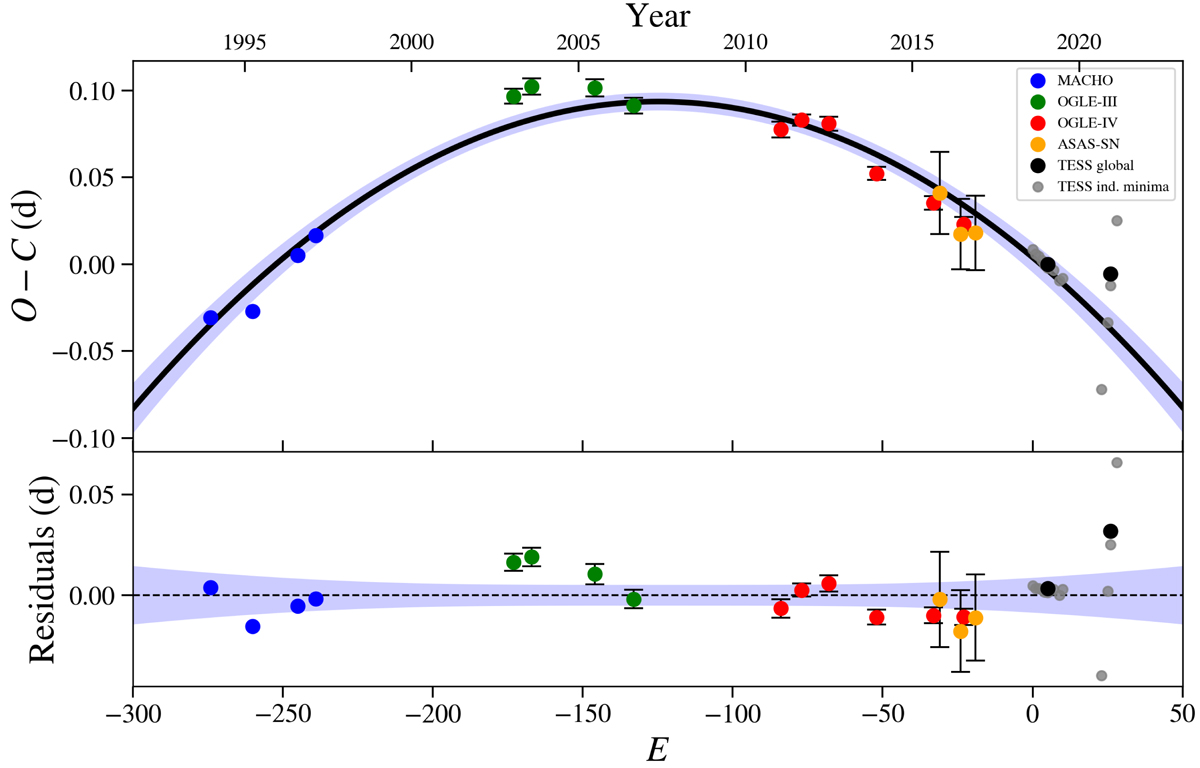
Fig. 15.
Download original image
O − C diagram for the ExtEEV (top) and residuals from the fitted parabolic model (bottom). The values of O − C for the ground-based surveys and TESS mission are marked with different colours presented in the legend. For TESS data, we provide two types of O − C values. Black points correspond to the global fit to TESS year 1 and 3 data, while grey points represent O − C derived from the observed times of minimum light (bottom part of Table 6). Epoch E stands for the number of orbital cycles that elapsed from the reference time of minimum light, Tref = BJD 2458340.66829. The fitted parabolic model is shown with a solid black line. The blueish shaded areas around the solid and dashed lines denote 1σ confidence intervals of the best fit.
Current usage metrics show cumulative count of Article Views (full-text article views including HTML views, PDF and ePub downloads, according to the available data) and Abstracts Views on Vision4Press platform.
Data correspond to usage on the plateform after 2015. The current usage metrics is available 48-96 hours after online publication and is updated daily on week days.
Initial download of the metrics may take a while.