Fig. 14.
Download original image
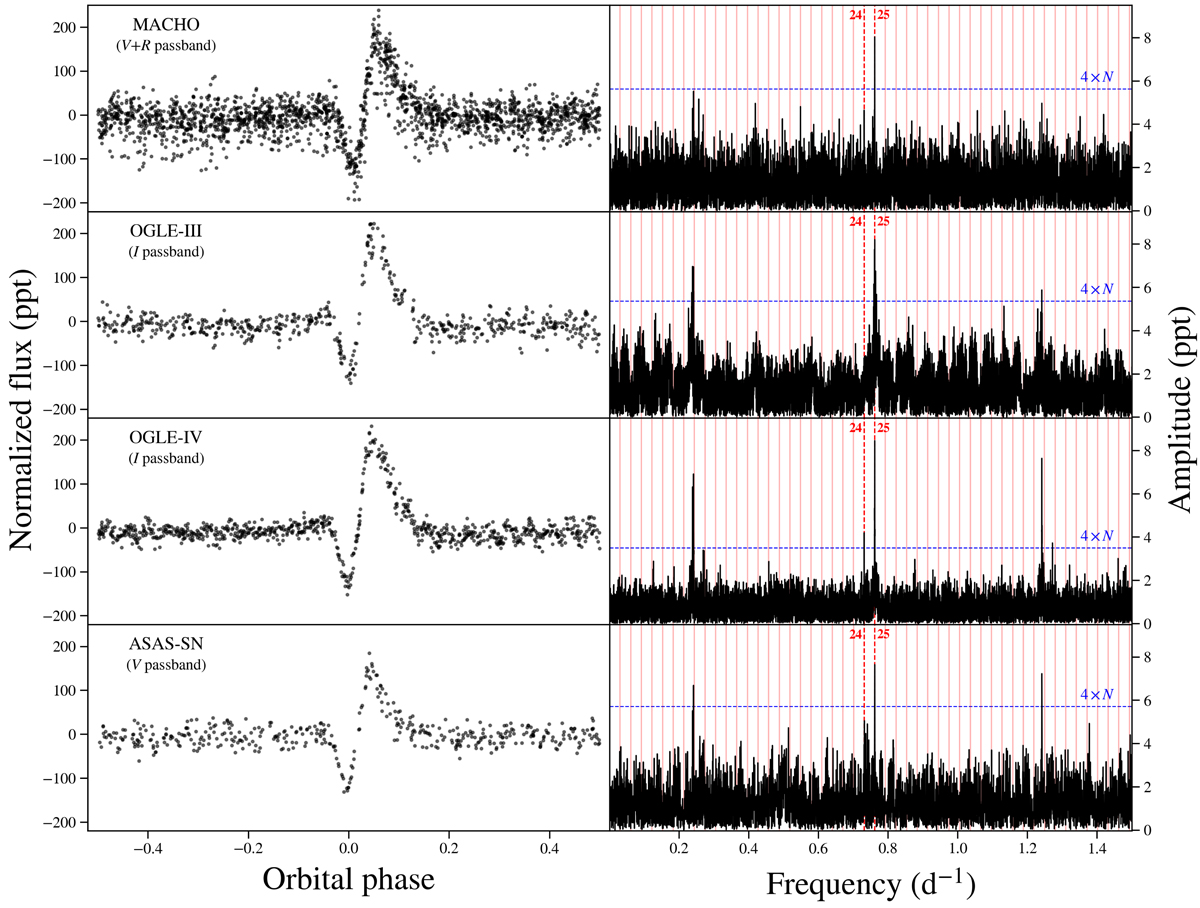
Phased light curves of the ExtEEV from four ground-based projects (left) and their frequency spectra after the subtraction of the heartbeat (right). Blue horizontal lines show the 4 × N detection threshold, while the series of vertical solid lines mark the position of consecutive harmonics of the orbital frequency. The pair of thick vertical red lines denote the position of n = 24 and n = 25 TEOs. We note the presence of daily aliases of the n = 25 TEO at ∼0.24 d−1 and ∼1.24 d−1. Phase 0.0 corresponds to BJD 2458373.61518.
Current usage metrics show cumulative count of Article Views (full-text article views including HTML views, PDF and ePub downloads, according to the available data) and Abstracts Views on Vision4Press platform.
Data correspond to usage on the plateform after 2015. The current usage metrics is available 48-96 hours after online publication and is updated daily on week days.
Initial download of the metrics may take a while.