Free Access
Fig. 11.
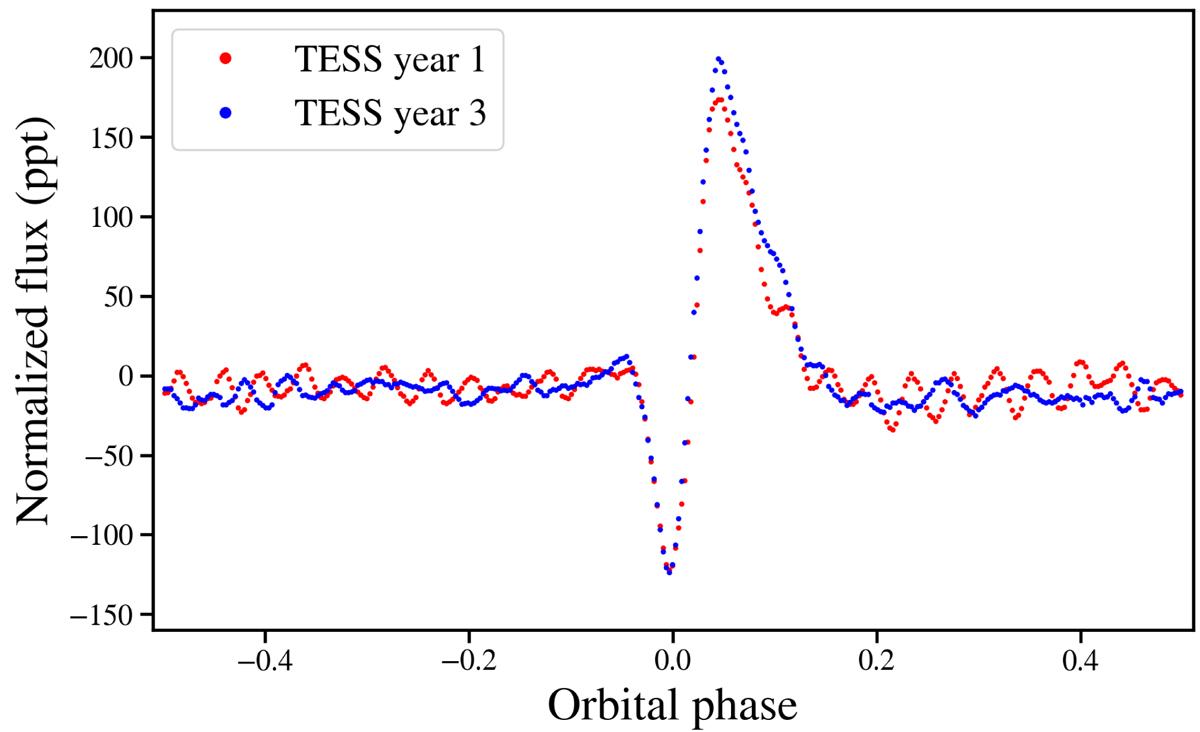
Download original image
Comparison between phased TESS year 1 (red dots) and year 3 (blue dots) light curves of the ExtEEV, averaged in 0.003 phase bins. The variability, other than the heartbeat and TEOs, was subtracted.
Current usage metrics show cumulative count of Article Views (full-text article views including HTML views, PDF and ePub downloads, according to the available data) and Abstracts Views on Vision4Press platform.
Data correspond to usage on the plateform after 2015. The current usage metrics is available 48-96 hours after online publication and is updated daily on week days.
Initial download of the metrics may take a while.