Fig. 10.
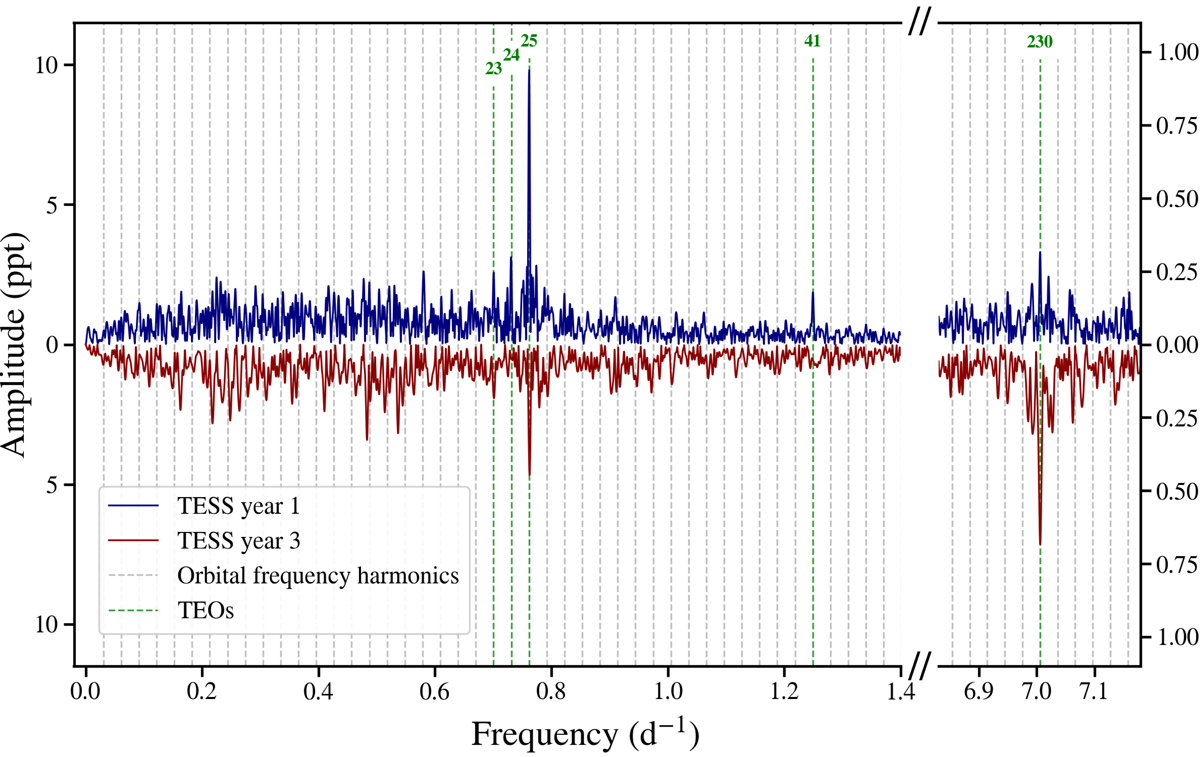
Download original image
Comparison between Fourier frequency spectra calculated separately for TESS year 1 (upper blue curve) and TESS year 3 (lower red curve) data. For the sake of clarity, all variability, except TEOs, has been subtracted from the light curve. Detrending at the lowest frequencies was also applied. The vertical grey dashed lines mark the position of the consecutive harmonics of the orbital frequency. The location of detected TEOs is denoted with vertical green dashed lines and is labelled with n. Both parts of the frequency spectra have a different ordinate scale.
Current usage metrics show cumulative count of Article Views (full-text article views including HTML views, PDF and ePub downloads, according to the available data) and Abstracts Views on Vision4Press platform.
Data correspond to usage on the plateform after 2015. The current usage metrics is available 48-96 hours after online publication and is updated daily on week days.
Initial download of the metrics may take a while.