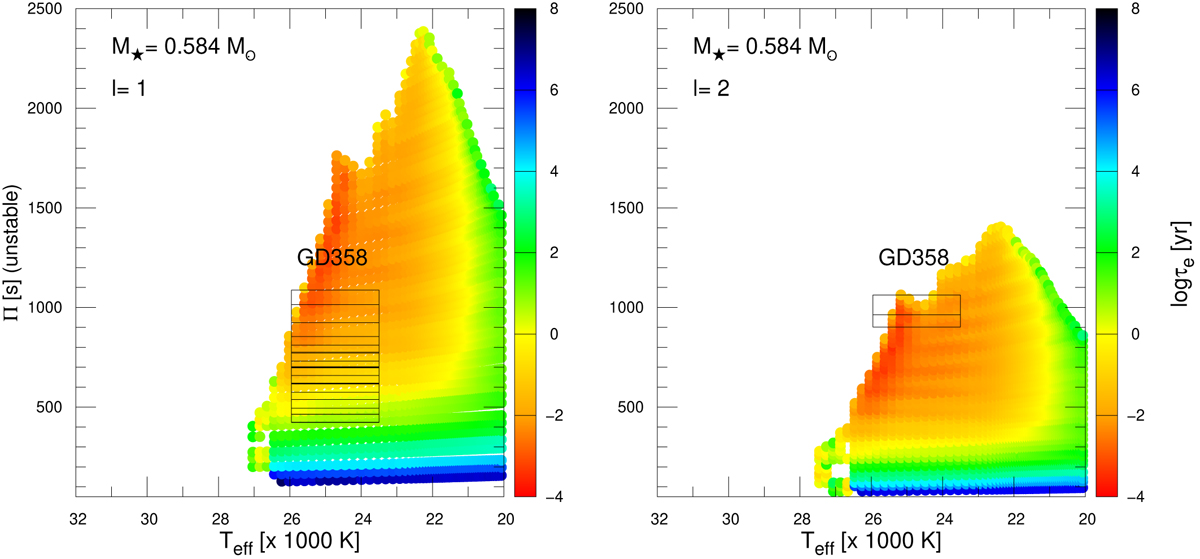
Fig. 9.
Download original image
Left panel: periods of excited ℓ = 1 g modes as a function of the effective temperature, with the palette of colors (right scale) indicating the logarithm of the e-folding time (τe in years), for the DB WD sequence with M⋆ = 0.584 M⊙. Right panel: same as left panel, but for ℓ = 2 modes. In both panels, the pulsation periods of the DBV star GD 358, with the identification of ℓ according to our asteroseismological model (see Table 4), are shown as horizontal segments, where their widths represent the possible Teff interval, according to spectroscopy.
Current usage metrics show cumulative count of Article Views (full-text article views including HTML views, PDF and ePub downloads, according to the available data) and Abstracts Views on Vision4Press platform.
Data correspond to usage on the plateform after 2015. The current usage metrics is available 48-96 hours after online publication and is updated daily on week days.
Initial download of the metrics may take a while.