Fig. 8.
Download original image
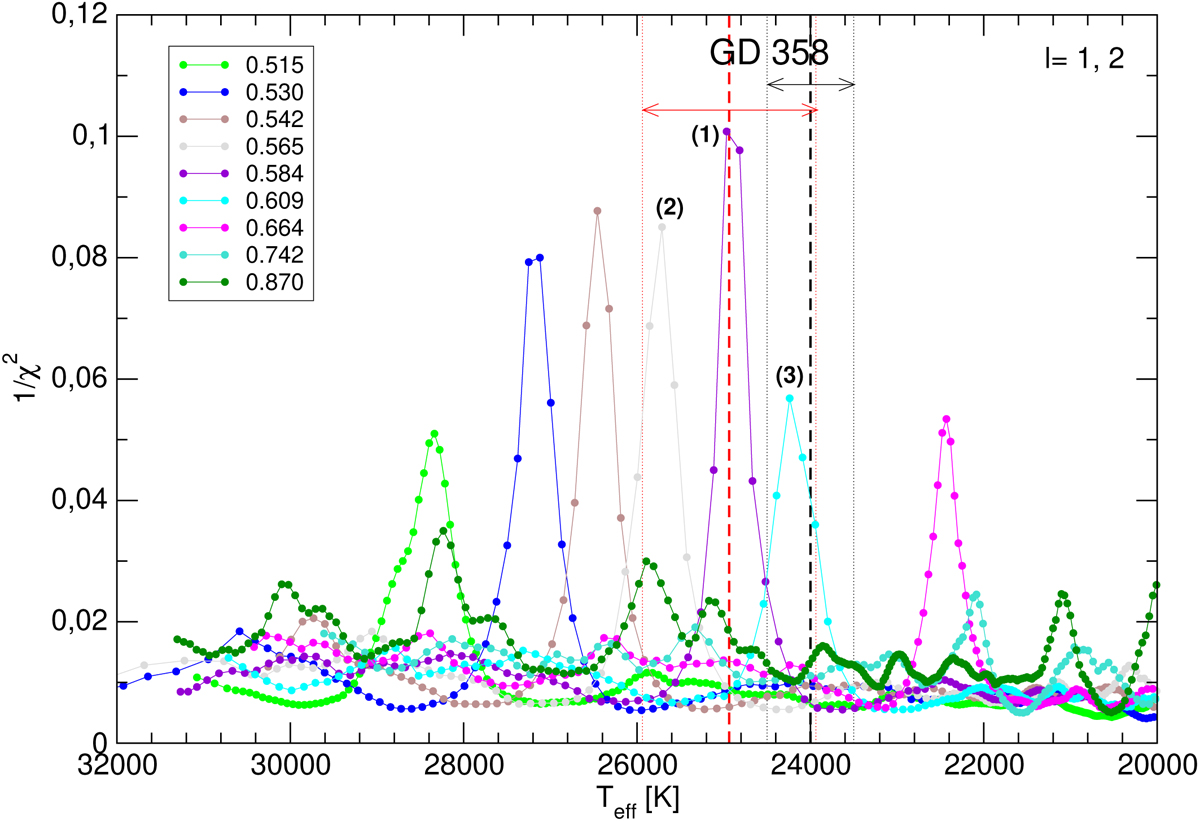
Inverse of the quality function of the period fit in terms of the effective temperature, shown with different colors for the different stellar masses. The vertical black-dashed line corresponds to the spectroscopic Teff of GD 358 and the vertical dotted lines show its uncertainties (Teff = 24 000 ± 500 K; Koester et al. 2014). Analogously, the blue vertical lines correspond to the spectroscopic Teff and its uncertainties as given by Bédard et al. (2017) (Teff = 24 937 ± 1 018 K). Three maxima have been labeled as (1), (2), and (3), corresponding to the three asteroseismological solutions compatible with spectroscopy (see the text).
Current usage metrics show cumulative count of Article Views (full-text article views including HTML views, PDF and ePub downloads, according to the available data) and Abstracts Views on Vision4Press platform.
Data correspond to usage on the plateform after 2015. The current usage metrics is available 48-96 hours after online publication and is updated daily on week days.
Initial download of the metrics may take a while.