Fig. 6.
Download original image
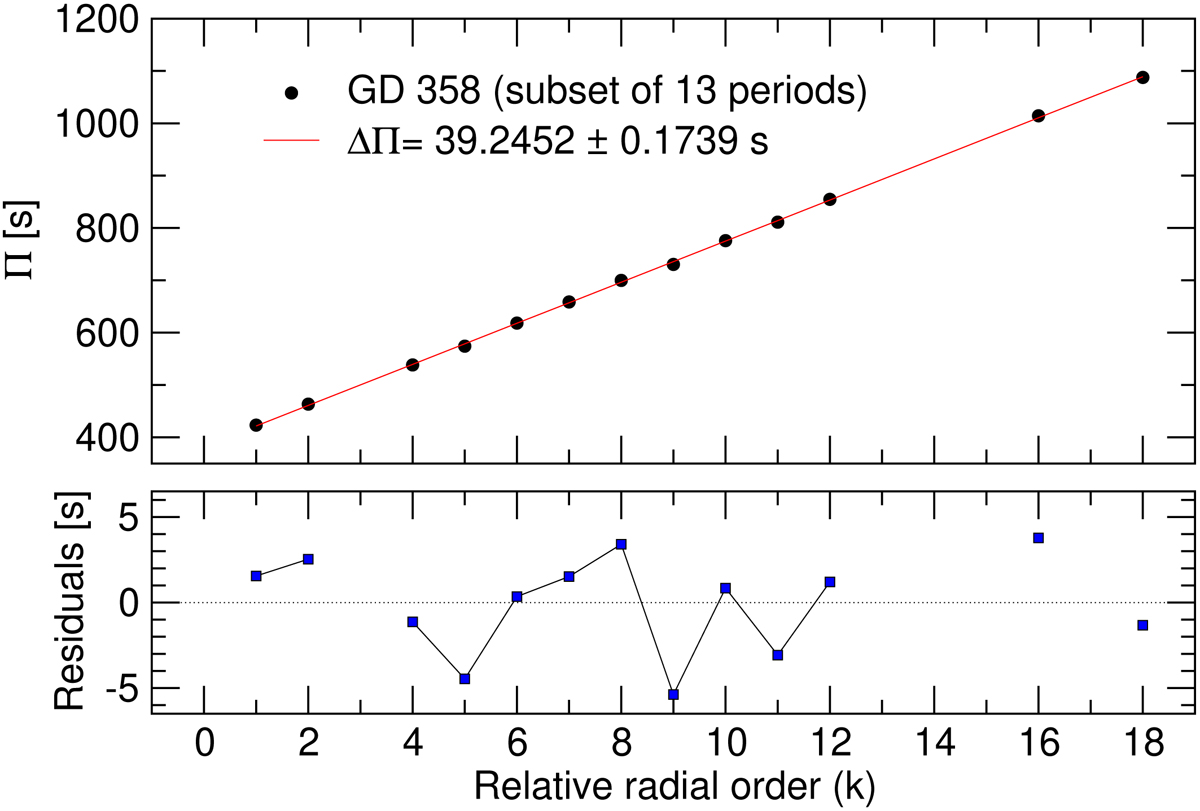
Upper panel: linear least-squares fit to the 13 periods of GD 358 marked with asterisks in Table 3. The derived period spacing from this fit is ΔΠ = 39.25 ± 0.17 s. Lower panel: residuals of the period distribution relative to the mean period spacing, revealing signals of mode trapping in the period spectrum of GD 358. Modes with a consecutive radial order are connected with thin black lines.
Current usage metrics show cumulative count of Article Views (full-text article views including HTML views, PDF and ePub downloads, according to the available data) and Abstracts Views on Vision4Press platform.
Data correspond to usage on the plateform after 2015. The current usage metrics is available 48-96 hours after online publication and is updated daily on week days.
Initial download of the metrics may take a while.